We are excited to announce the release of the Business Intelligence App, version 1.7.0.
The Business Intelligence App, version 1.7.0 includes the following updates:
- Added Distributed High Availability (HA).
- Added Swagger REST API functionality.
- UI enhancements:
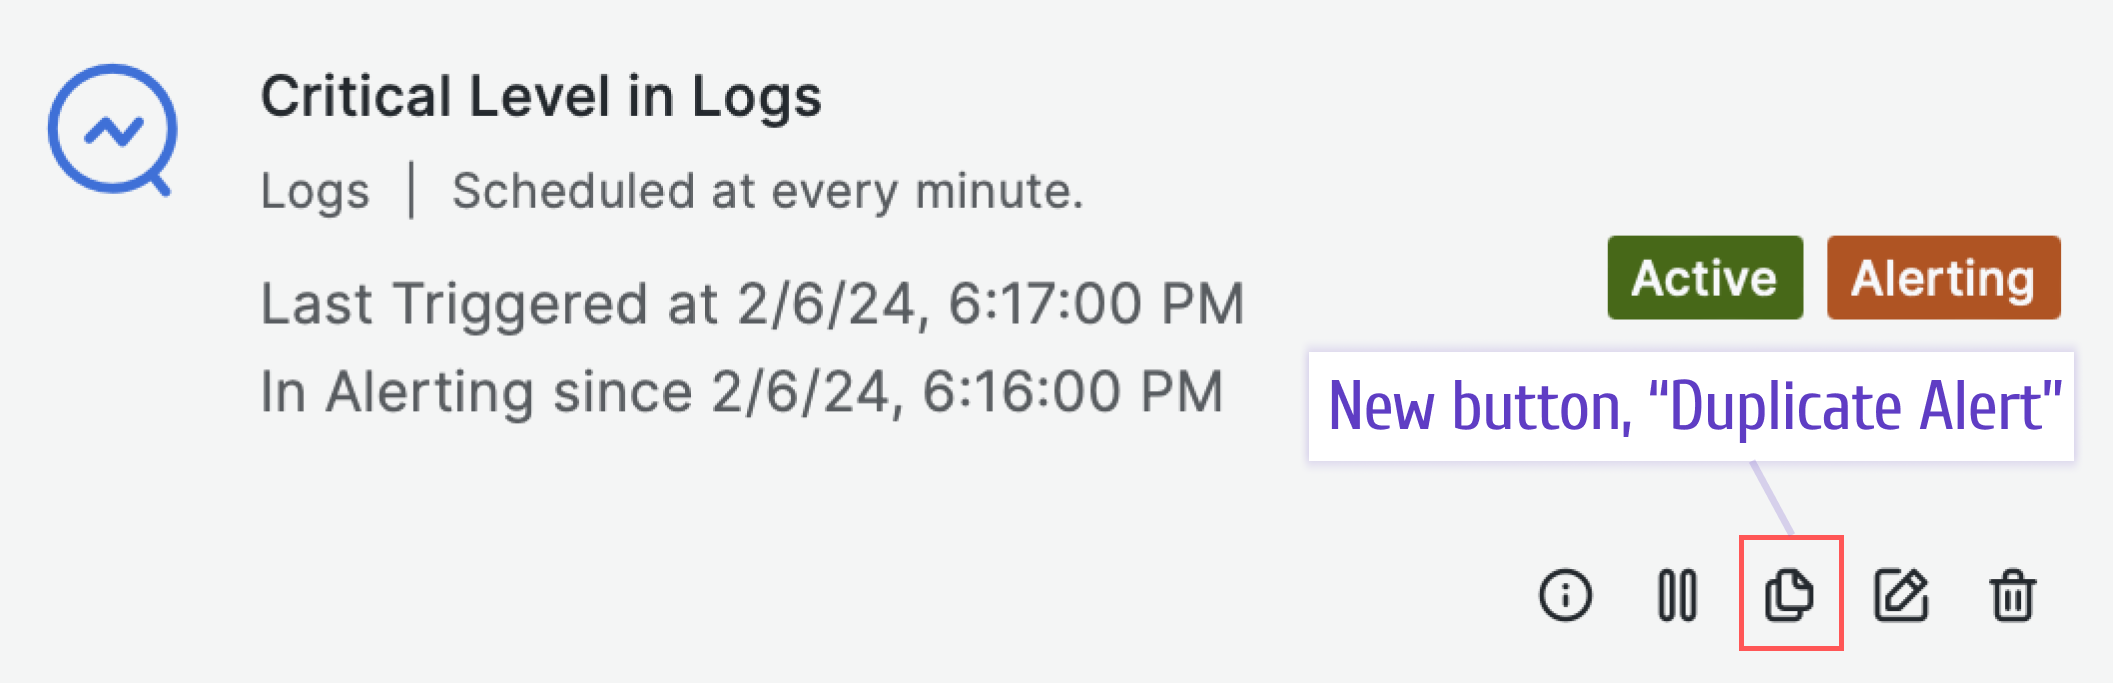
- Added a new Duplicate alert button.
- Improved dashboard refresh functionality.
- Extended CRON validator rule set.
- Enabled the use of custom variable values in alert rule configuration.
Distributed High Availability
One of the most requested capabilities is the High Availability (HA) setup. We designed the BI App specifically keeping that in mind.
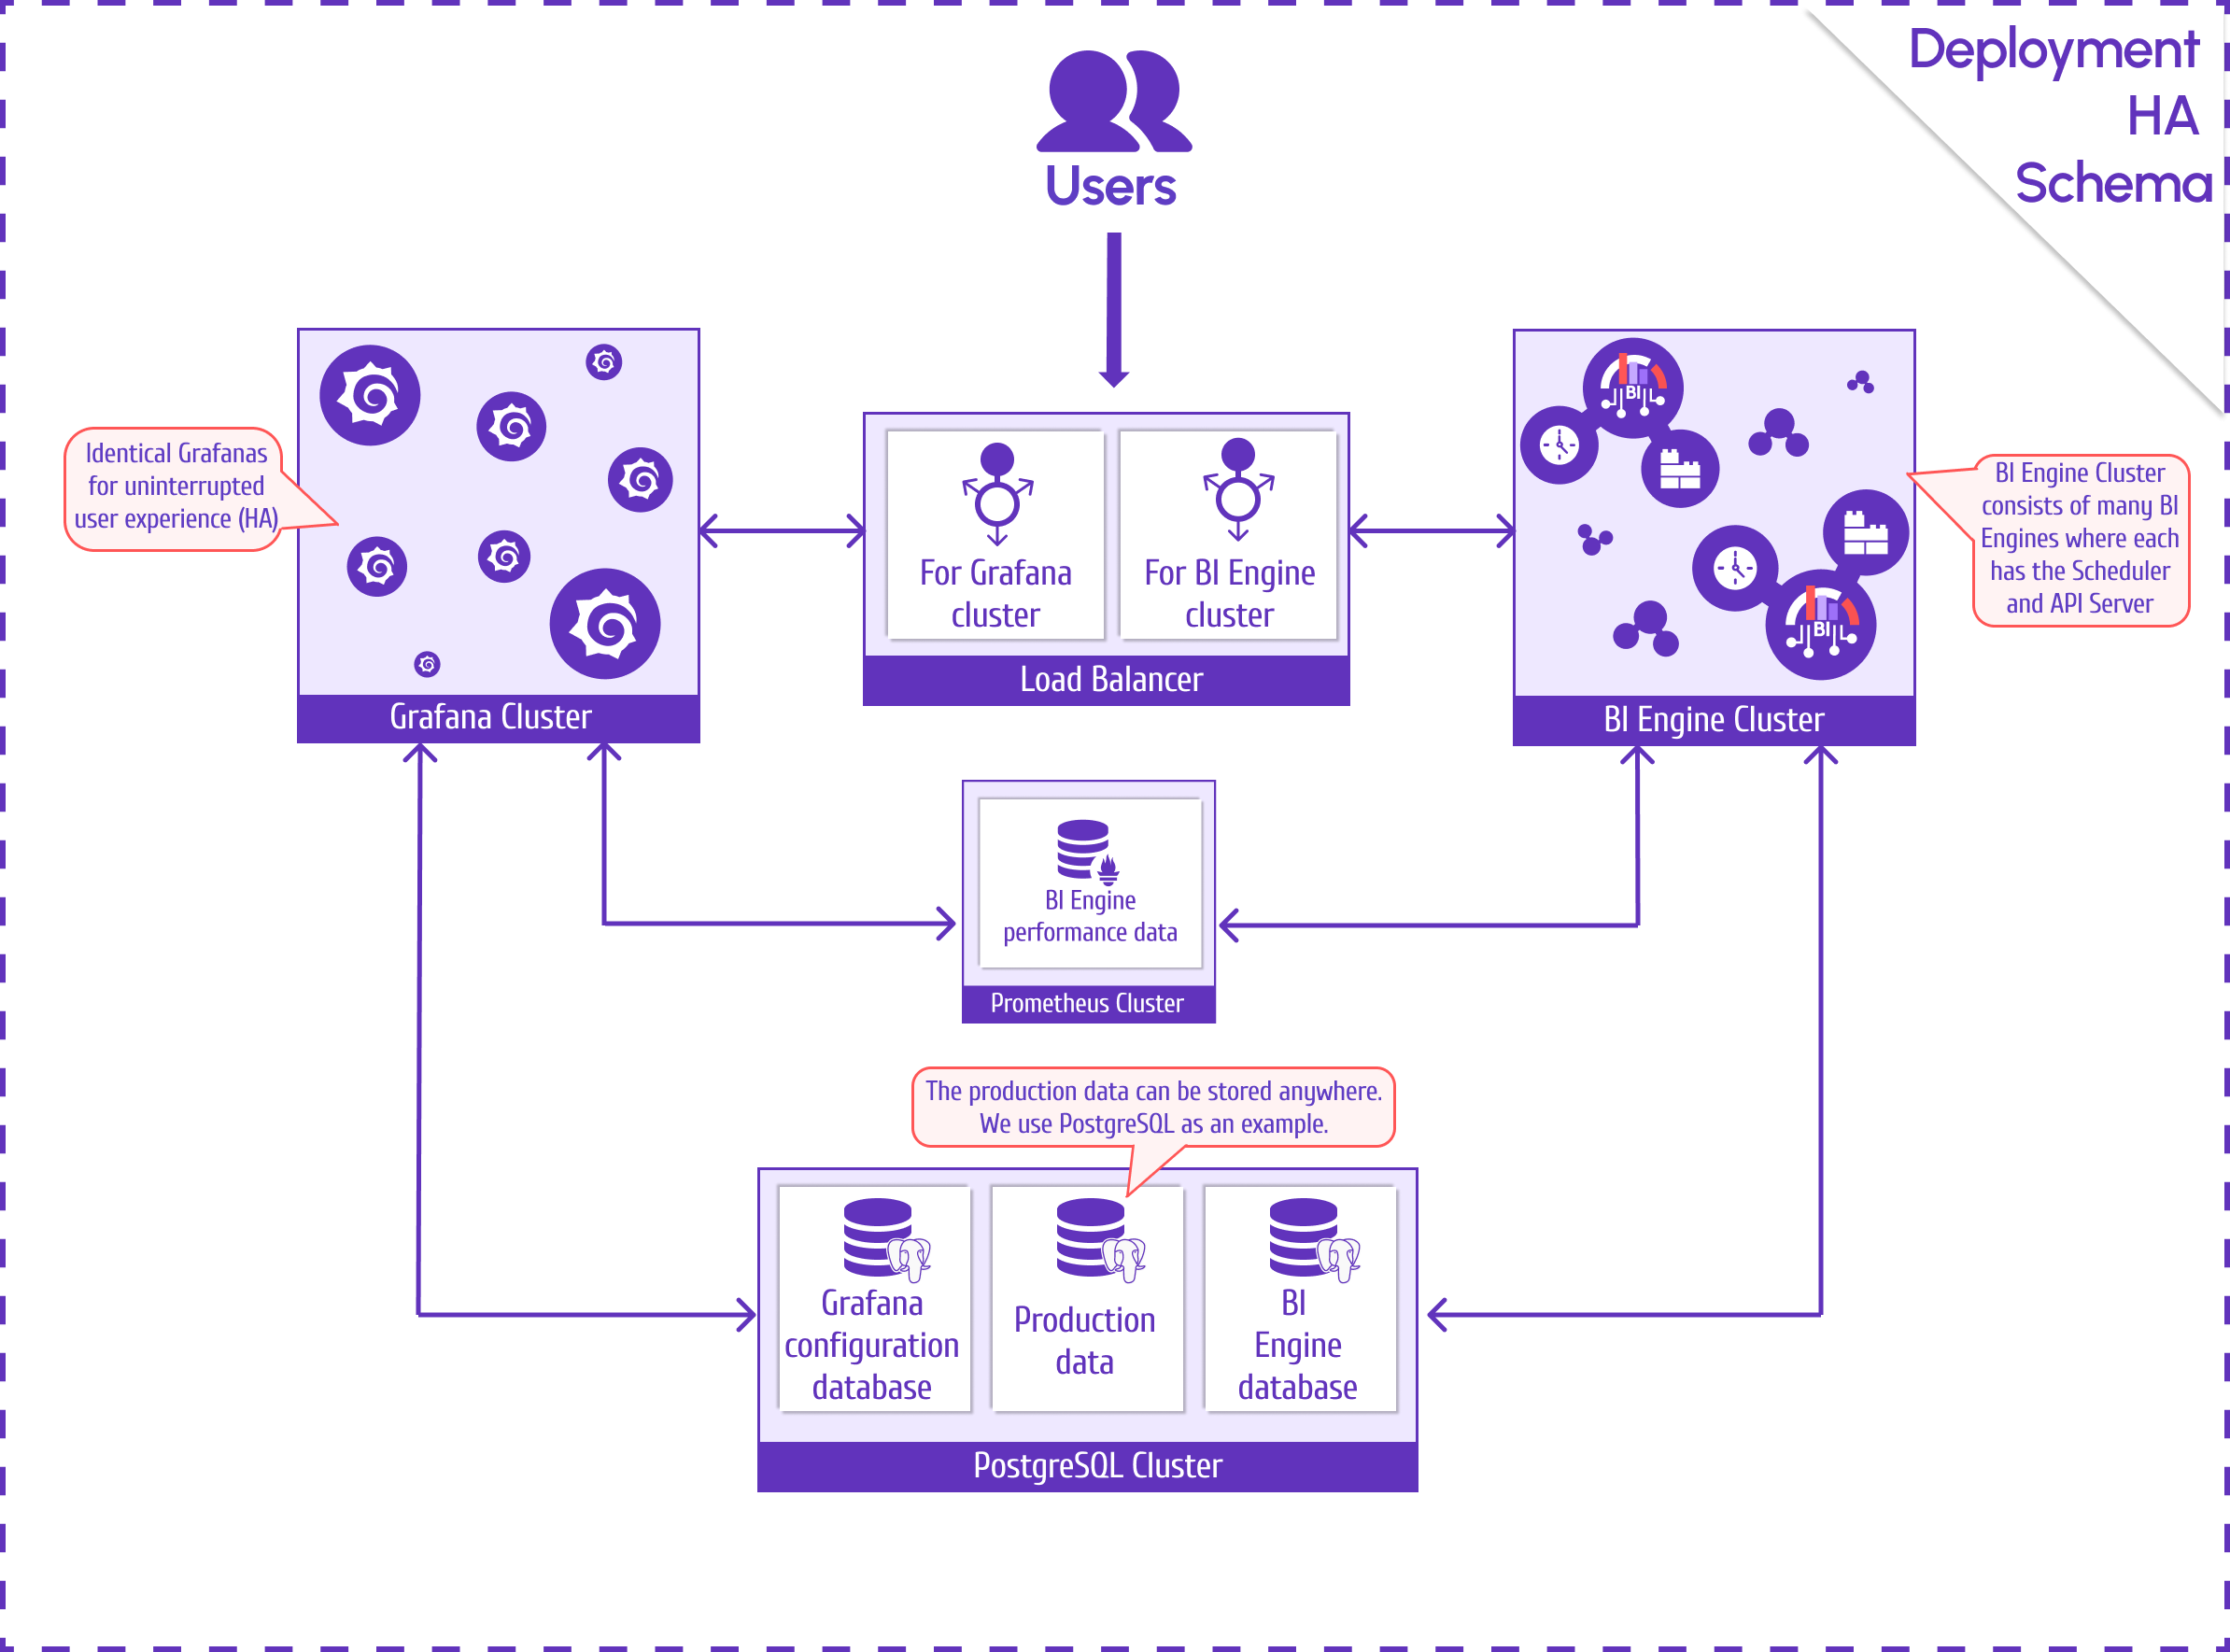
All BI App system components could exist in clusters, where a cluster is a set of mirrored servers. It is done to primarily facilitate uninterrupted service by distributing the load most efficiently.
- BI Engine Cluster:
- Requests to Server API are distributed behind the Load Balancer.
- Schedulers distribute alert rules automatically.
- Grafana Cluster visualizes data and provides HTTP API for BI Engine to retrieve configuration and data.
- Prometheus Cluster stores BI Engine performance data.
- PostgreSQL Cluster stores:
- BI Engine database.
- Grafana configuration database.
- Production data.
Below is the picture to illustrate the current HA setup.
Swagger REST API
Starting from this release, you can use the Swagger REST API to automate configuration and get data from BI Engine. The detailed instructions are available in the REST API section of our documentation.
UI Updates
Duplicate Alert
We added one more action button. Now you can create a new alert using a previously created one as a template.
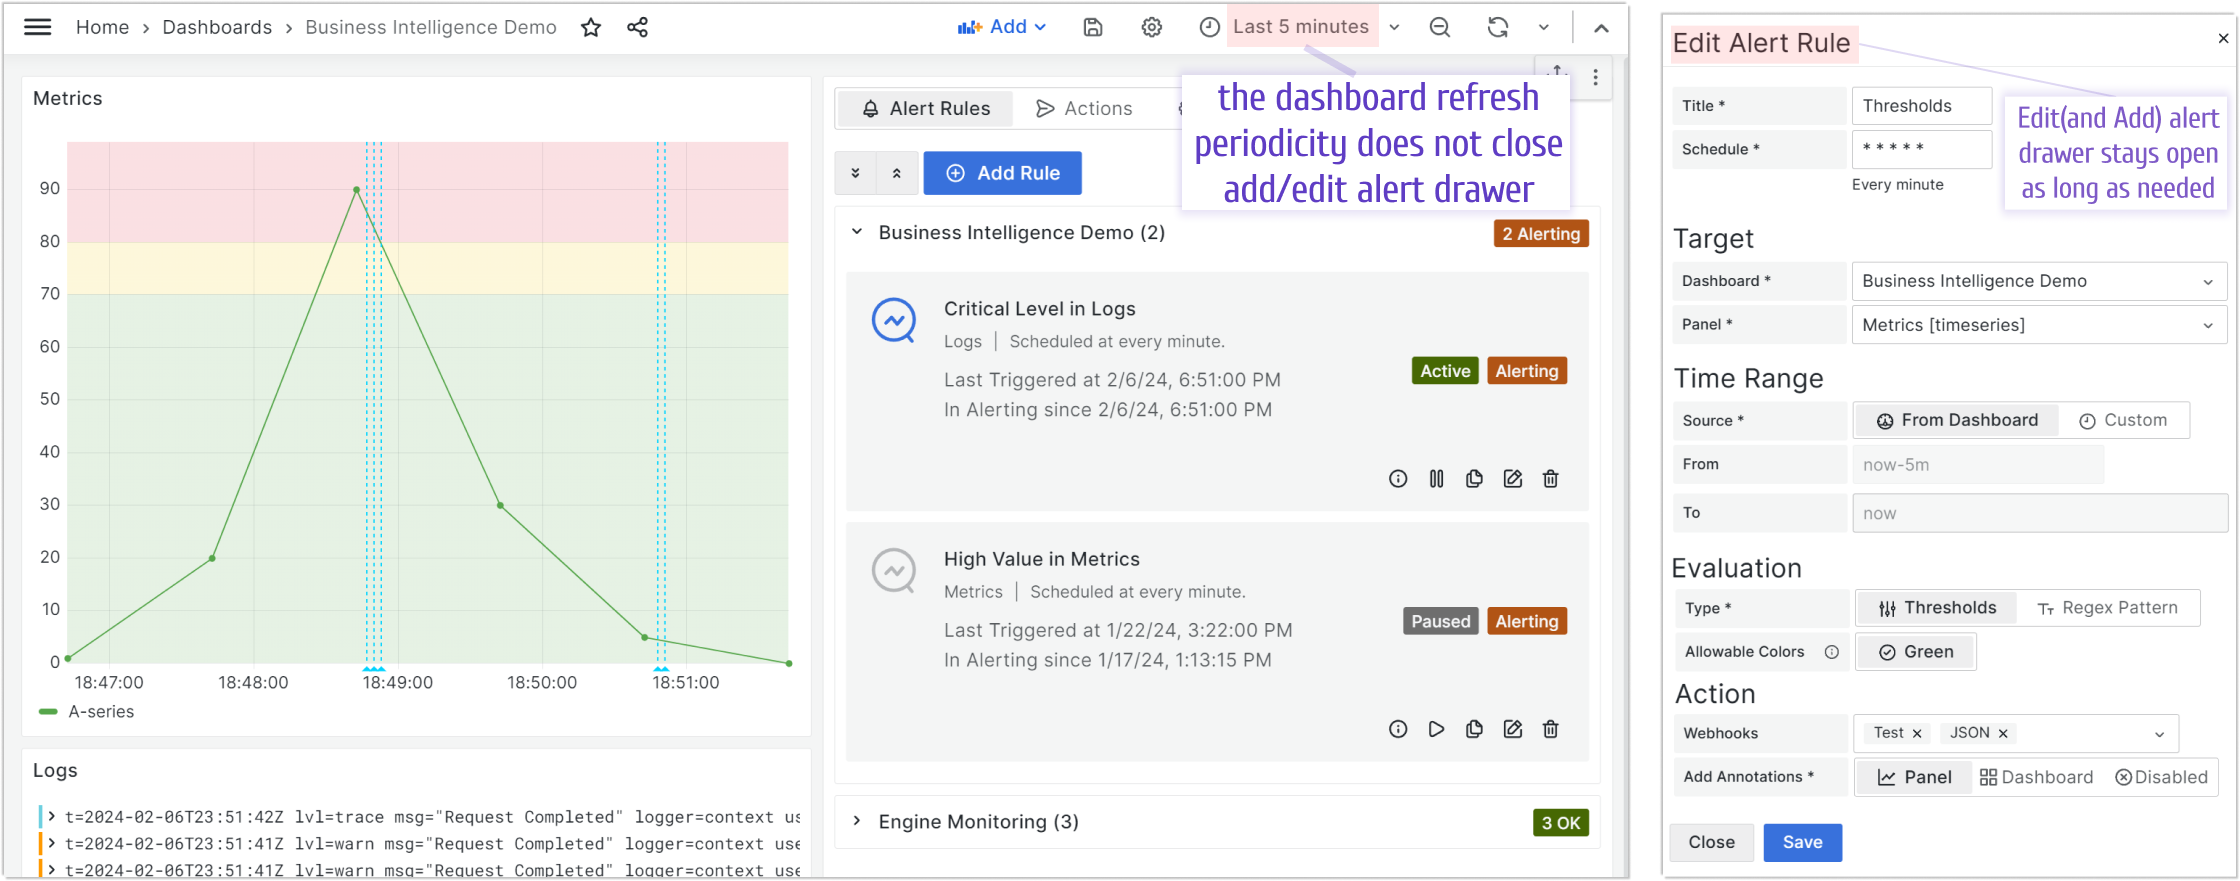
Dashboard Refresh
Until this release, with every dashboard refresh, the add/edit drawer was automatically closing. That imposed challenges with adding/editing an alert rule when the refresh time was less than 2-3 minutes. With this update, the add/edit window stays up regardless of the dashboard refresh periodicity.
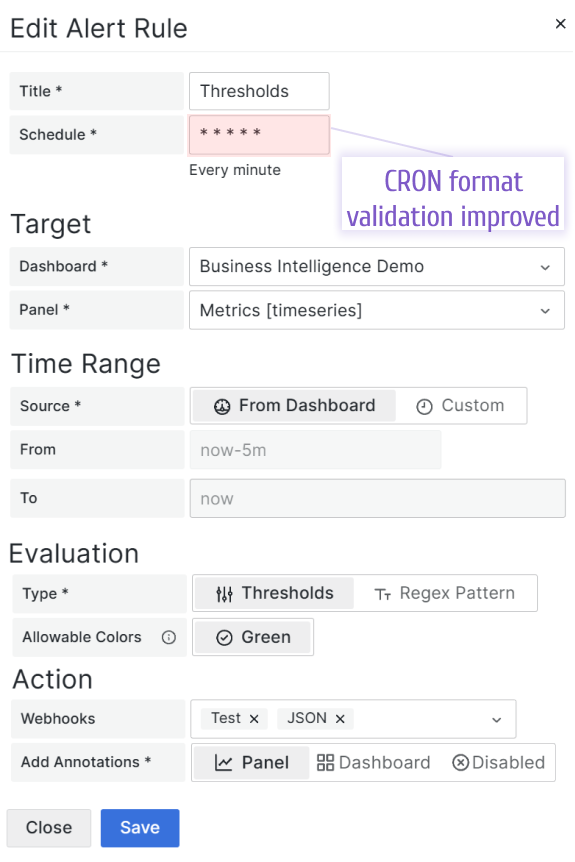
CRON Validator
We improved the CRON format validation. After this change, you will always see an error if the format you entered is erroneous.
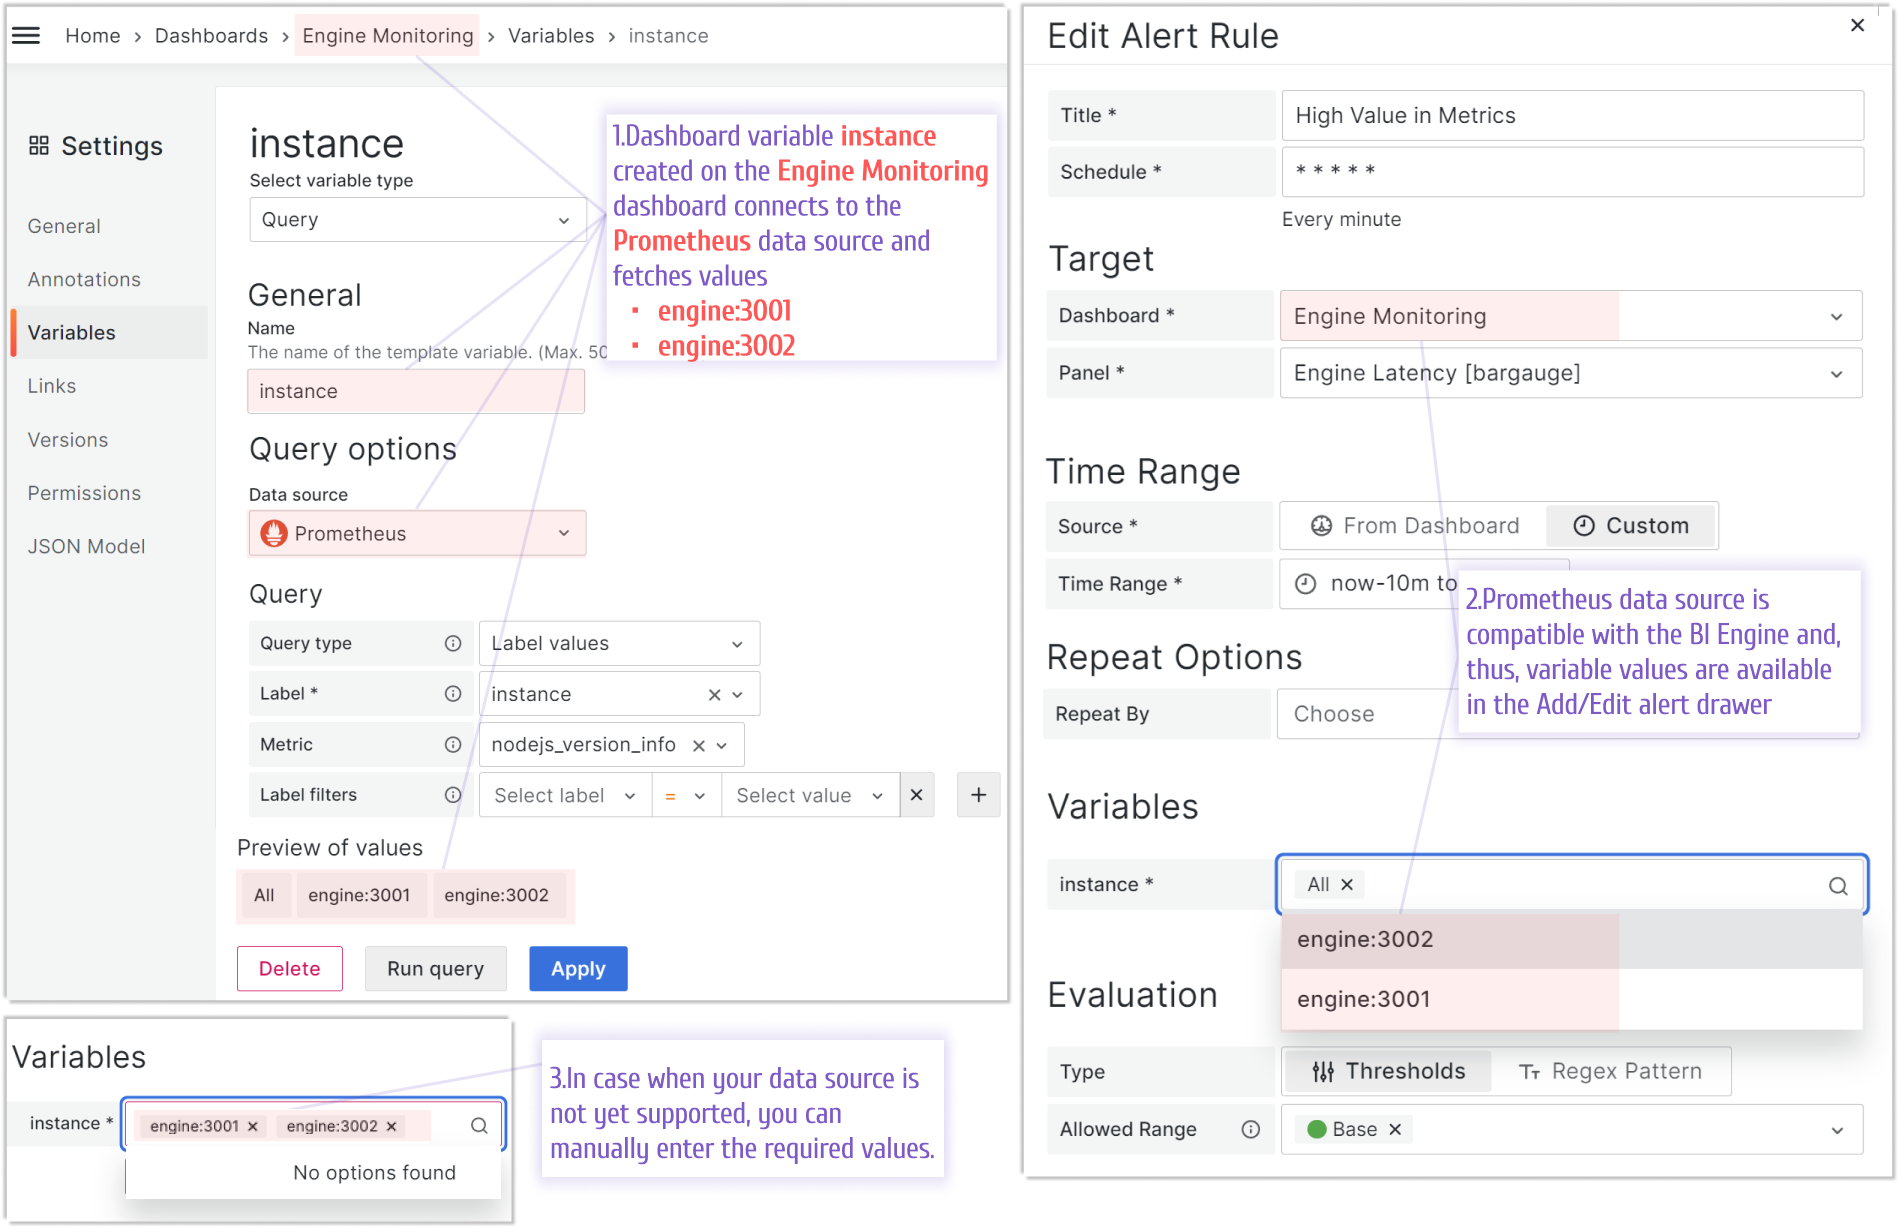
Custom variable values
Grafana supports a wide range of data sources. From the beginning, we ensured the compatibility between the BI Engine and SQL and Prometheus data sources. We are actively working on ensuring many other data sources are compatible.
However, in the case when variables for your particular data source are not yet supported, we allow to specify variable values directly on the Add/Edit alert drawer.
Getting Started
You can download the Development release from our GitHub repository and follow this hands-on tutorial.
Docker Compose
The docker-compose.yml file consists of the following containers:
- Grafana includes the provisioned BI Engine data source, an Alerting panel, and dashboards.
- Timescale is required to store configuration, events, rules, etc.
- BI Engine has a service account key to access Grafana HTTP APIs. It evaluates alert rules and calls webhooks when alert statuses change.
- JSON webhook is a webhook example based on NodeJS, which accepts alert payload and saves it to the files for testing purposes.
- Prometheus collects and store performance metrics from BI Engine.
loading...
Start
When you run a docker-compose file, it launches the Grafana, Timescale, BI Engine, Prometheus and Webhook containers:
docker compose pull && docker compose up
Stop
Stop and remove all containers:
docker compose down
Release Notes
Features / Enhancements
- Updated BI App and BI Engine (#12)
- [App] Added support dashboard refresh to alerting panel.
- [App] Added filter rows from panel targets.
- [App] Added enter custom variable values if unable to load options.
- [App] Added cron validator to validate alert schedule.
- [App] Added copy alert button.
- [Engine] Added alerts assignment between engine nodes.
- [Engine] Added Swagger REST API documentation.
Feedback
We're looking forward to hearing from you. You can use different ways to get in touch with us.
- Ask a question, request a new feature, or report an issue at GitHub issues.
- Subscribe to our YouTube Channel and leave your comments.
- Support our project by starring the repository.