Since we added the external libraries feature along with the JavaScript functionality, the Dynamic Text plugin can not stop surprising us with its applicability.
We already demonstrated how as in one-two-three you can incorporate Plotly 3D Scatter, Mermaid, Chart.js, and Flowchart.
This article is an instruction provided by Raghavendra Samant based on Josiah Solomon contributions. It outlines the steps and demonstrates an example of how D3.js library can be incorporated into your Grafana dashboard.
At a glance
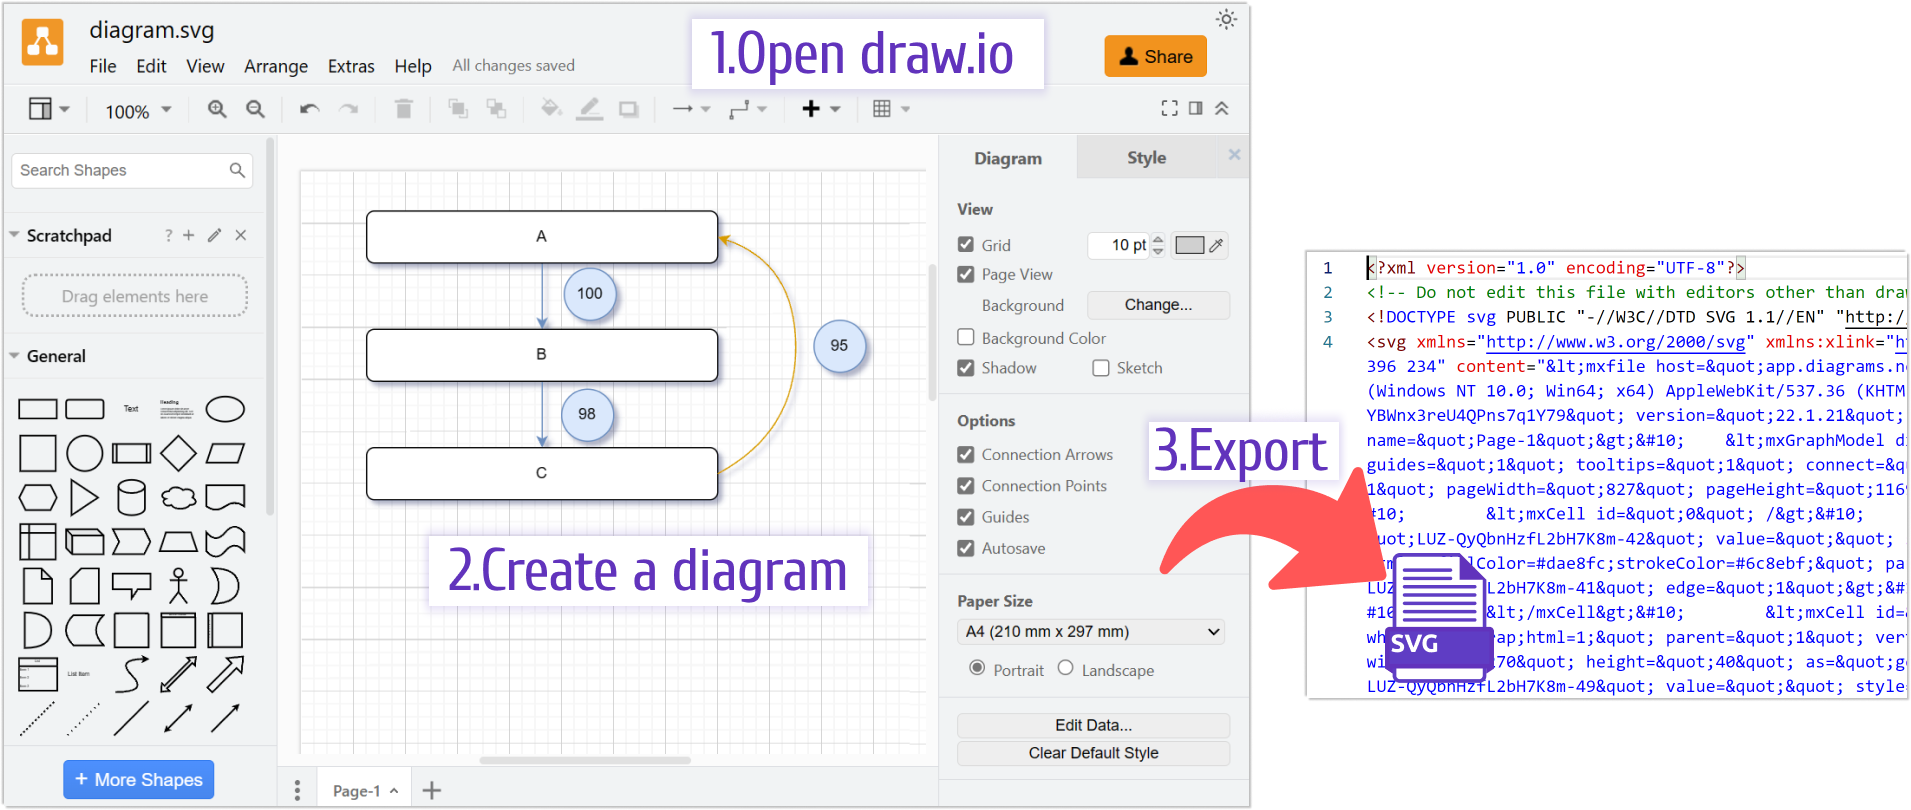
If you want to create a process flow chart that can be easily referenced in a Grafana dashboard, one option is to use a standard flow charting tool like Draw.io to design the chart and save it as an SVG file.
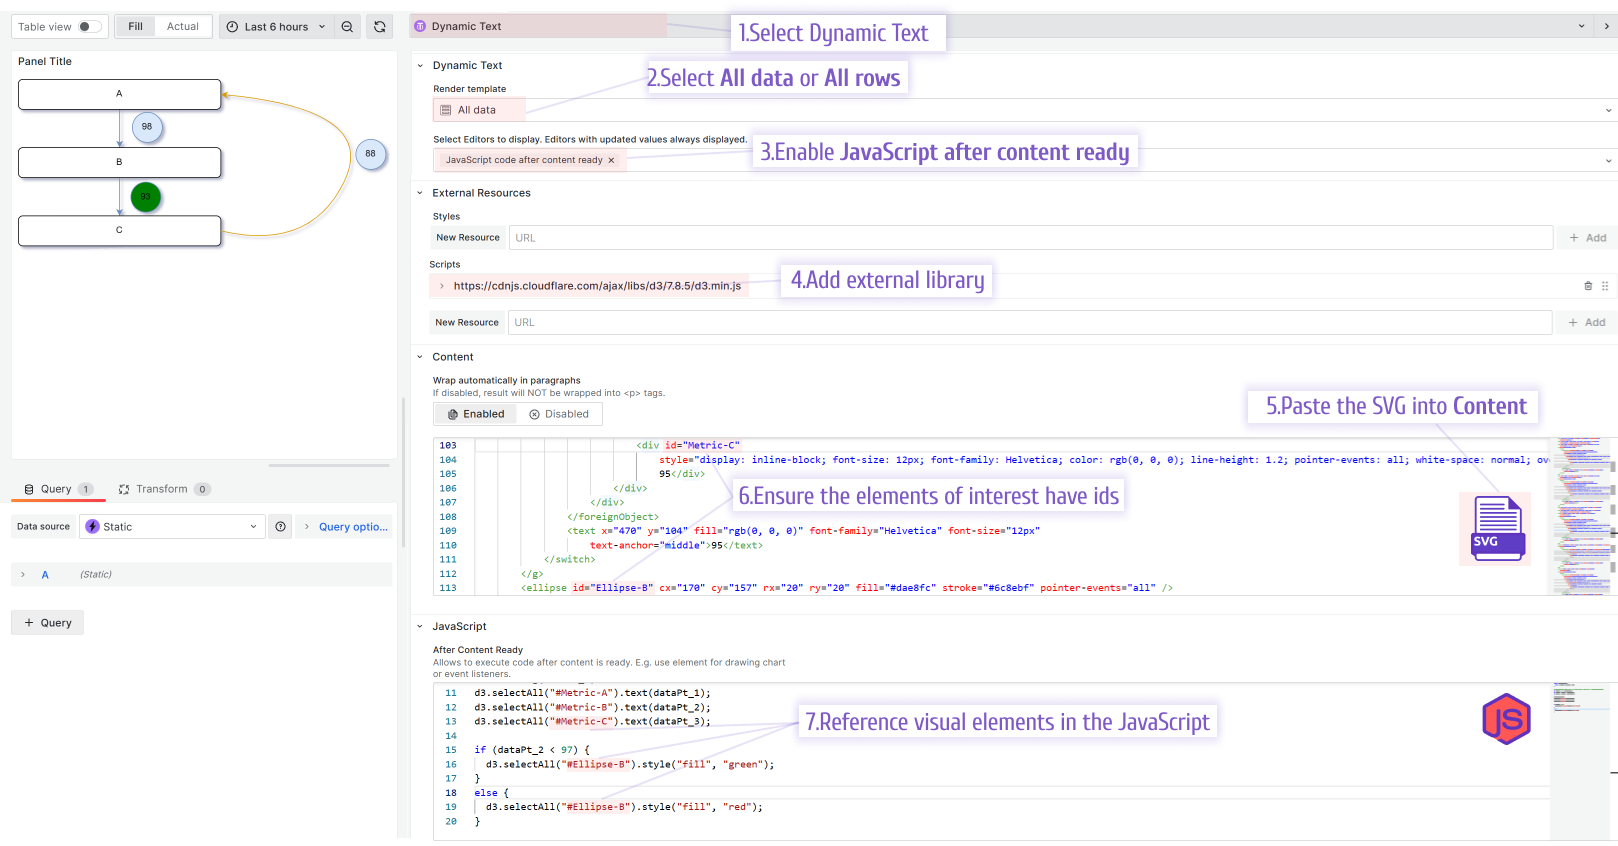
This file can then be imported into the Grafana's Dynamic Text plugin developed by Volkov Labs, which allows you to display and interact with the chart directly within the dashboard.
To take things a step further, you can use the Dynamic Text plugin's ability to link external JavaScript libraries and CSS stylesheets to add additional functionality to the chart.
For example, you could use the popular data visualization library D3.js to display real-time metric values directly on the flow chart. The Dynamic Text plugin also includes hooks for controlling data manipulation before and after the content is rendered, giving you even greater flexibility over how the metrics on the chart are displayed and changed based on data in real time.
Overall, combining the power of tools like Draw.io and open-source Dynamic Text plugin makes it easy to create dynamic, interactive flow charts that can be seamlessly integrated into your dashboards and updated as needed.
To learn more about these features and how to use them, check out the official documentation for the Dynamic Text plugin here.
Detailed steps
How to use Grafana's Dynamic Text panel and display real-time metric values on the chart using the D3.js library:
- Design the process flow chart in Draw.io and save it as an SVG file. You can include shapes, connectors, text labels, and other elements as desired. Make sure to give the chart a clear, descriptive name so that it will be easy to identify later.
- In Grafana, navigate to the dashboard where you want to display the flow chart and click on the "Add Panel" button. Type "Text" as the panel type and choose the "Dynamic Text" plugin.
- Copy and paste the SVG code for the flow chart into the Dynamic Text panel editor (Content). You can access the SVG code by opening the saved file in a text editor or viewing the source code for the chart in a web browser.
- Use the Dynamic Text plugin's panel options to customize the data binding aspects of the flow chart. Details are in the documentation link above.
- Link the D3.js library and any required CSS stylesheets using the Dynamic Text plugin's settings. This will allow you to use D3.js functions and methods to manipulate the flow chart and display real-time metric values.
- Write the D3.js code to select specific elements on the flow chart and bind them to data sources. For example, you might use the select method to target certain shapes or text labels, and then use the data method to associate those elements with live metric values.
- Define the behavior of the chart using the Dynamic Text plugin's hooks. These hooks allow you to run custom JavaScript code before and after the content is rendered, enabling you to perform calculations, apply transformations, or trigger animations based on changes in the underlying data.
- Save the Dynamic Text panel and test the flow chart to ensure that it displays correctly and updates in response to changes in the metric data. You may need to fine-tune the placement and formatting of the chart elements or adjust the timing of the hook functions to get everything working smoothly.
- Once the flow chart is finalized, you can publish the dashboard and share it with team members or stakeholders as needed. They will be able to see the process flow chart alongside relevant metric data and understand how different components of the system fit together.
By following these steps, you can create a dynamic, interactive process flow chart that integrates seamlessly with your Grafana dashboards and provides valuable insights into the performance of your systems.
Code to Copy
SVG file
<?xml version="1.0" encoding="UTF-8"?>
<!-- Do not edit this file with editors other than draw.io -->
<!DOCTYPE svg PUBLIC "-//W3C//DTD SVG 1.1//EN" "http://www.w3.org/Graphics/SVG/1.1/DTD/svg11.dtd">
<svg xmlns="http://www.w3.org/2000/svg" xmlns:xlink="http://www.w3.org/1999/xlink" version="1.1" width="491px" height="223px" viewBox="-0.5 -0.5 491 223" content="<mxfile host="app.diagrams.net" modified="2024-01-19T20:39:06.420Z" agent="Mozilla/5.0 (Macintosh; Intel Mac OS X 10_15_7) AppleWebKit/605.1.15 (KHTML, like Gecko) Version/17.2.1 Safari/605.1.15" etag="6pgwlFJk3I_YgIuAIzpk" version="22.1.21" type="device"><diagram id="r6o4K_kWlicXEwS6FW9g" name="Page-1">5VdZc9owEP41PNLxfTwmQKFTMmmG6TTtm7DXB5EtRpYB59dXjmV8KBxpaY7pE9pPu1rtt4fFQB8luylF6+iG+IAHmuLvBvp4oGmqoRj8p0SKCnEUvQJCGvtCqQEW8SMIUBFoHvuQdRQZIZjF6y7okTQFj3UwRCnZdtUCgrte1ygECVh4CMvoj9hnkYhCsxt8BnEY1Z5Vy612ElQri0iyCPlk24L0yUAfUUJYtUp2I8AleTUvld3nA7v7i1FI2TkG8++/hnfF3TKdPQZzbTmzvzrJ0NCqYzYI5yJicVtW1BSAzxkRIqEsIiFJEZ406DUleepD6UfhUqMzJ2TNQZWDK2CsEOlFOSMciliCxW4QYzwimNAnj7qPwAk8jmeMkgdo7VieA8uA78jRC0IyklMPjoUs8sEQDYEdUxQnlvG3XAh2p0ASYLTgChQwYvGmWzFIFF6412tywxciPS9JlSKl6krKVZOJktZtFDNYrNETH1veoF3WD3K4AcpgdzRmsWuKS4nu1oW4bVpFswUWtdqkjuXyJLn/Xz3XY/FkPZvvq55VKVXXUq5OVHC33C9fz2p9wtsVtCmxNHpvLHGaXo8ldjsBdxF8ufGU24dksdqupjDUT3e9l9PNngNI/avyccBFD6Msi71DjJUDAHYxu68t+fpniX8yhTTetdTGRS2kPK69USm0rEqxMXuSarve5AgCsLxnJ4dvu0tF+bvJYZ47OZQzJ0erAMxn8l9jZw8Y4eEbiXls+/LT3V79Wb26qiIXVu0nUe8gw+gXcu+gihnpIF47qGiprUuF7PCFJT+WcvRept7VtzvqfFFdoOmXfQr+vIUMqYVcU/50Yswf3nD6aXHBD+BLxlJveqvyc8R4zbFky5w6H4xTrc+pZb8tp47EqVpf8QORqnX72/hXnHKx+YdZjYrmf7o++Q0=</diagram></mxfile>" style="background-color: rgb(255, 255, 255);"><defs/><g><g id="cell-LUZ-QyQbnHzfL2bH7K8m-42"><path d="M 135 40 L 135 84.63" fill="none" stroke="#6c8ebf" stroke-miterlimit="10" pointer-events="stroke"/><path d="M 135 89.88 L 131.5 82.88 L 135 84.63 L 138.5 82.88 Z" fill="#6c8ebf" stroke="#6c8ebf" stroke-miterlimit="10" pointer-events="all"/></g><g id="cell-LUZ-QyQbnHzfL2bH7K8m-40"><rect x="0" y="0" width="270" height="40" rx="6" ry="6" fill="rgb(255, 255, 255)" stroke="rgb(0, 0, 0)" pointer-events="all"/><g transform="translate(-0.5 -0.5)"><switch><foreignObject pointer-events="none" width="100%" height="100%" requiredFeatures="http://www.w3.org/TR/SVG11/feature#Extensibility" style="overflow: visible; text-align: left;"><div xmlns="http://www.w3.org/1999/xhtml" style="display: flex; align-items: unsafe center; justify-content: unsafe center; width: 268px; height: 1px; padding-top: 20px; margin-left: 1px;"><div data-drawio-colors="color: rgb(0, 0, 0); " style="box-sizing: border-box; font-size: 0px; text-align: center;"><div style="display: inline-block; font-size: 12px; font-family: Helvetica; color: rgb(0, 0, 0); line-height: 1.2; pointer-events: all; white-space: normal; overflow-wrap: normal;">A</div></div></div></foreignObject><text x="135" y="24" fill="rgb(0, 0, 0)" font-family="Helvetica" font-size="12px" text-anchor="middle">A</text></switch></g></g><g id="cell-LUZ-QyQbnHzfL2bH7K8m-49"><path d="M 135 131 L 135 175.63" fill="none" stroke="#6c8ebf" stroke-miterlimit="10" pointer-events="stroke"/><path d="M 135 180.88 L 131.5 173.88 L 135 175.63 L 138.5 173.88 Z" fill="#6c8ebf" stroke="#6c8ebf" stroke-miterlimit="10" pointer-events="all"/></g><g id="cell-LUZ-QyQbnHzfL2bH7K8m-41"><rect x="0" y="91" width="270" height="40" rx="6" ry="6" fill="rgb(255, 255, 255)" stroke="rgb(0, 0, 0)" pointer-events="all"/><g transform="translate(-0.5 -0.5)"><switch><foreignObject pointer-events="none" width="100%" height="100%" requiredFeatures="http://www.w3.org/TR/SVG11/feature#Extensibility" style="overflow: visible; text-align: left;"><div xmlns="http://www.w3.org/1999/xhtml" style="display: flex; align-items: unsafe center; justify-content: unsafe center; width: 268px; height: 1px; padding-top: 111px; margin-left: 1px;"><div data-drawio-colors="color: rgb(0, 0, 0); " style="box-sizing: border-box; font-size: 0px; text-align: center;"><div style="display: inline-block; font-size: 12px; font-family: Helvetica; color: rgb(0, 0, 0); line-height: 1.2; pointer-events: all; white-space: normal; overflow-wrap: normal;">B</div></div></div></foreignObject><text x="135" y="115" fill="rgb(0, 0, 0)" font-family="Helvetica" font-size="12px" text-anchor="middle">B</text></switch></g></g><g id="cell-LUZ-QyQbnHzfL2bH7K8m-45"><rect x="0" y="182" width="270" height="40" rx="6" ry="6" fill="rgb(255, 255, 255)" stroke="rgb(0, 0, 0)" pointer-events="all"/><g transform="translate(-0.5 -0.5)"><switch><foreignObject pointer-events="none" width="100%" height="100%" requiredFeatures="http://www.w3.org/TR/SVG11/feature#Extensibility" style="overflow: visible; text-align: left;"><div xmlns="http://www.w3.org/1999/xhtml" style="display: flex; align-items: unsafe center; justify-content: unsafe center; width: 268px; height: 1px; padding-top: 202px; margin-left: 1px;"><div data-drawio-colors="color: rgb(0, 0, 0); " style="box-sizing: border-box; font-size: 0px; text-align: center;"><div style="display: inline-block; font-size: 12px; font-family: Helvetica; color: rgb(0, 0, 0); line-height: 1.2; pointer-events: all; white-space: normal; overflow-wrap: normal;">C</div></div></div></foreignObject><text x="135" y="206" fill="rgb(0, 0, 0)" font-family="Helvetica" font-size="12px" text-anchor="middle">C</text></switch></g></g><g id="cell-tOEe9SfIMc0OkmSjwjGe-3"><path d="M 270 202 Q 390 230 435 135 Q 480 40 276.34 20.6" fill="none" stroke="#d79b00" stroke-miterlimit="10" pointer-events="stroke"/><path d="M 271.11 20.11 L 278.41 17.29 L 276.34 20.6 L 277.75 24.25 Z" fill="#d79b00" stroke="#d79b00" stroke-miterlimit="10" pointer-events="all"/></g><g id="cell-tOEe9SfIMc0OkmSjwjGe-4"><ellipse cx="470" cy="100" rx="20" ry="20" fill="#dae8fc" stroke="#6c8ebf" pointer-events="all"/><g transform="translate(-0.5 -0.5)"><switch><foreignObject pointer-events="none" width="100%" height="100%" requiredFeatures="http://www.w3.org/TR/SVG11/feature#Extensibility" style="overflow: visible; text-align: left;"><div xmlns="http://www.w3.org/1999/xhtml" style="display: flex; align-items: unsafe center; justify-content: unsafe center; width: 38px; height: 1px; padding-top: 100px; margin-left: 451px;"><div data-drawio-colors="color: rgb(0, 0, 0); " style="box-sizing: border-box; font-size: 0px; text-align: center;"><div style="display: inline-block; font-size: 12px; font-family: Helvetica; color: rgb(0, 0, 0); line-height: 1.2; pointer-events: all; white-space: normal; overflow-wrap: normal;">95</div></div></div></foreignObject><text x="470" y="104" fill="rgb(0, 0, 0)" font-family="Helvetica" font-size="12px" text-anchor="middle">95</text></switch></g></g><g id="cell-tOEe9SfIMc0OkmSjwjGe-7"><ellipse id="Ellipse-B" cx="170" cy="157" rx="20" ry="20" fill="#dae8fc" stroke="#6c8ebf" pointer-events="all"/><g transform="translate(-0.5 -0.5)"><switch><foreignObject pointer-events="none" width="100%" height="100%" requiredFeatures="http://www.w3.org/TR/SVG11/feature#Extensibility" style="overflow: visible; text-align: left;"><div xmlns="http://www.w3.org/1999/xhtml" style="display: flex; align-items: unsafe center; justify-content: unsafe center; width: 38px; height: 1px; padding-top: 157px; margin-left: 151px;"><div data-drawio-colors="color: rgb(0, 0, 0); " style="box-sizing: border-box; font-size: 0px; text-align: center;"><div style="display: inline-block; font-size: 12px; font-family: Helvetica; color: rgb(0, 0, 0); line-height: 1.2; pointer-events: all; white-space: normal; overflow-wrap: normal;">98</div></div></div></foreignObject><text x="170" y="161" fill="rgb(0, 0, 0)" font-family="Helvetica" font-size="12px" text-anchor="middle">98</text></switch></g></g><g id="cell-tOEe9SfIMc0OkmSjwjGe-8"><ellipse cx="172" cy="64" rx="20" ry="20" fill="#dae8fc" stroke="#6c8ebf" pointer-events="all"/><g transform="translate(-0.5 -0.5)"><switch><foreignObject pointer-events="none" width="100%" height="100%" requiredFeatures="http://www.w3.org/TR/SVG11/feature#Extensibility" style="overflow: visible; text-align: left;"><div xmlns="http://www.w3.org/1999/xhtml" style="display: flex; align-items: unsafe center; justify-content: unsafe center; width: 38px; height: 1px; padding-top: 64px; margin-left: 153px;"><div data-drawio-colors="color: rgb(0, 0, 0); " style="box-sizing: border-box; font-size: 0px; text-align: center;"><div style="display: inline-block; font-size: 12px; font-family: Helvetica; color: rgb(0, 0, 0); line-height: 1.2; pointer-events: all; white-space: normal; overflow-wrap: normal;">100</div></div></div></foreignObject><text x="172" y="68" fill="rgb(255, 255, 255)" font-family="Helvetica" font-size="12px" text-anchor="middle">100</text></switch></g></g></g><switch><g requiredFeatures="http://www.w3.org/TR/SVG11/feature#Extensibility"/><a transform="translate(0,-5)" xlink:href="https://www.drawio.com/doc/faq/svg-export-text-problems" target="_blank"><text text-anchor="middle" font-size="10px" x="50%" y="100%">Text is not SVG - cannot display</text></a></switch></svg>
JavaScript
function getRandomInt(max) {
  return Math.floor(Math.random() * max);
}

//console.log('After Content Ready : use Context object to access data ' + context.data[0].country)
var dataPt_1 = 100 - getRandomInt(9);
var dataPt_2 = dataPt_1 - getRandomInt(6);
var dataPt_3 = dataPt_2 - getRandomInt(12);

console.log(dataPt_1);
d3.selectAll("#Metric-A").text(dataPt_1);
d3.selectAll("#Metric-B").text(dataPt_2);
d3.selectAll("#Metric-C").text(dataPt_3);

if (dataPt_2 < 97) {
  d3.selectAll("#Ellipse-B").style("fill", "green");
} else {
  d3.selectAll("#Ellipse-B").style("fill", "red");
}
Let's sum up
The latest version of the Dynamic Text panel opens up a lot of possibilities that we can achieve with the Grafana dashboarding tool.
Also, it gives good control over what metrics can be shown and changed dynamically based on business needs.