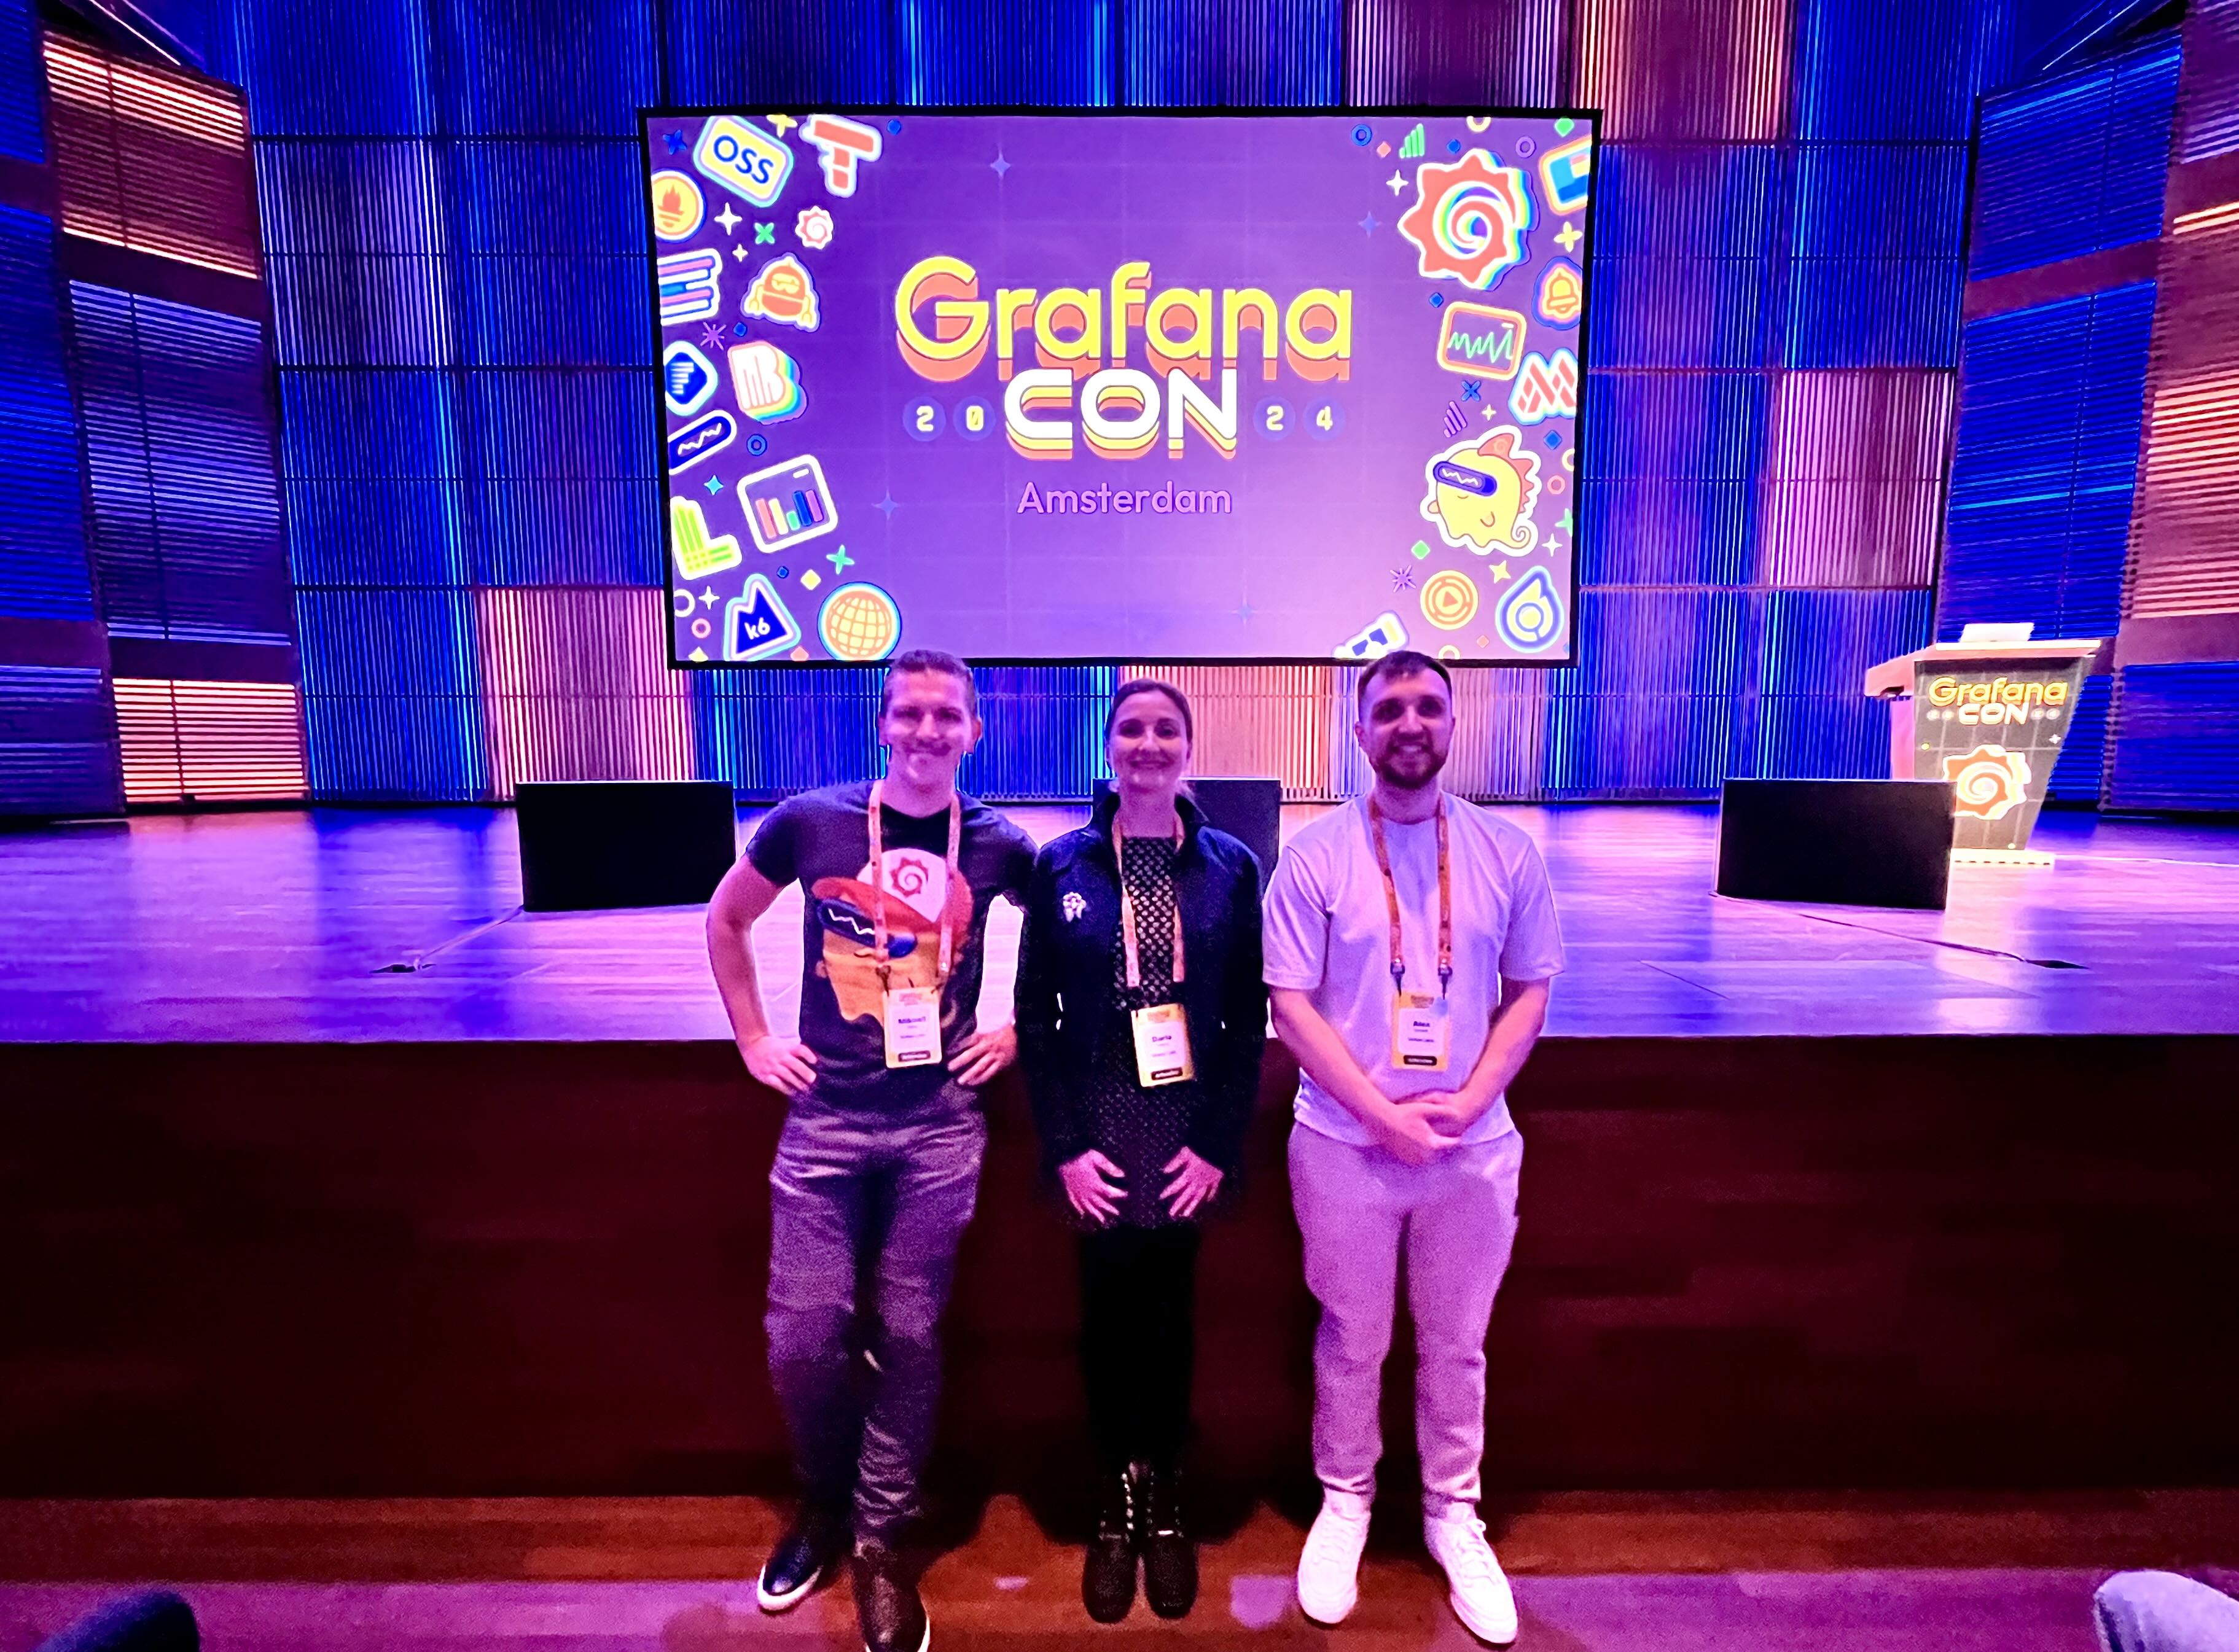
We love many exciting and inspiring things about Grafana, but one has a very special place in our hearts: the fact that Grafana holds in-person conferences around the world.
This spring event took place in Amsterdam, the Netherlands. It was two days packed with endless opportunities to find collaboration partners, meet extraordinary people, and savor fantastic food.
We flew in for a deep dive into Grafana culture and to learn about Grafana's priorities and plans. We came back stunned by the number of people who knew who we were. Just cruising around the conference halls with fresh lemonade and hearing 'Thank you for your plugins; they saved my company and me' was worth it all.
We are aware of quite astonishing statistics regarding the number of our plugins downloaded daily, however, meeting people in person and learning about their experiences was both rewarding and very informative.
Golden Grot Award Winner: Professional
We have been working with Theia Scientific and Chris Fields for almost three years. The project helps many nuclear scientists around the US swiftly and effectively determine the material quality under the microscope.
This year, the dashboard we collaborated on has been awarded the Golden Grot. There are only two dashboard Golden Grot award winners a year: one in the personal and another in the professional categories.
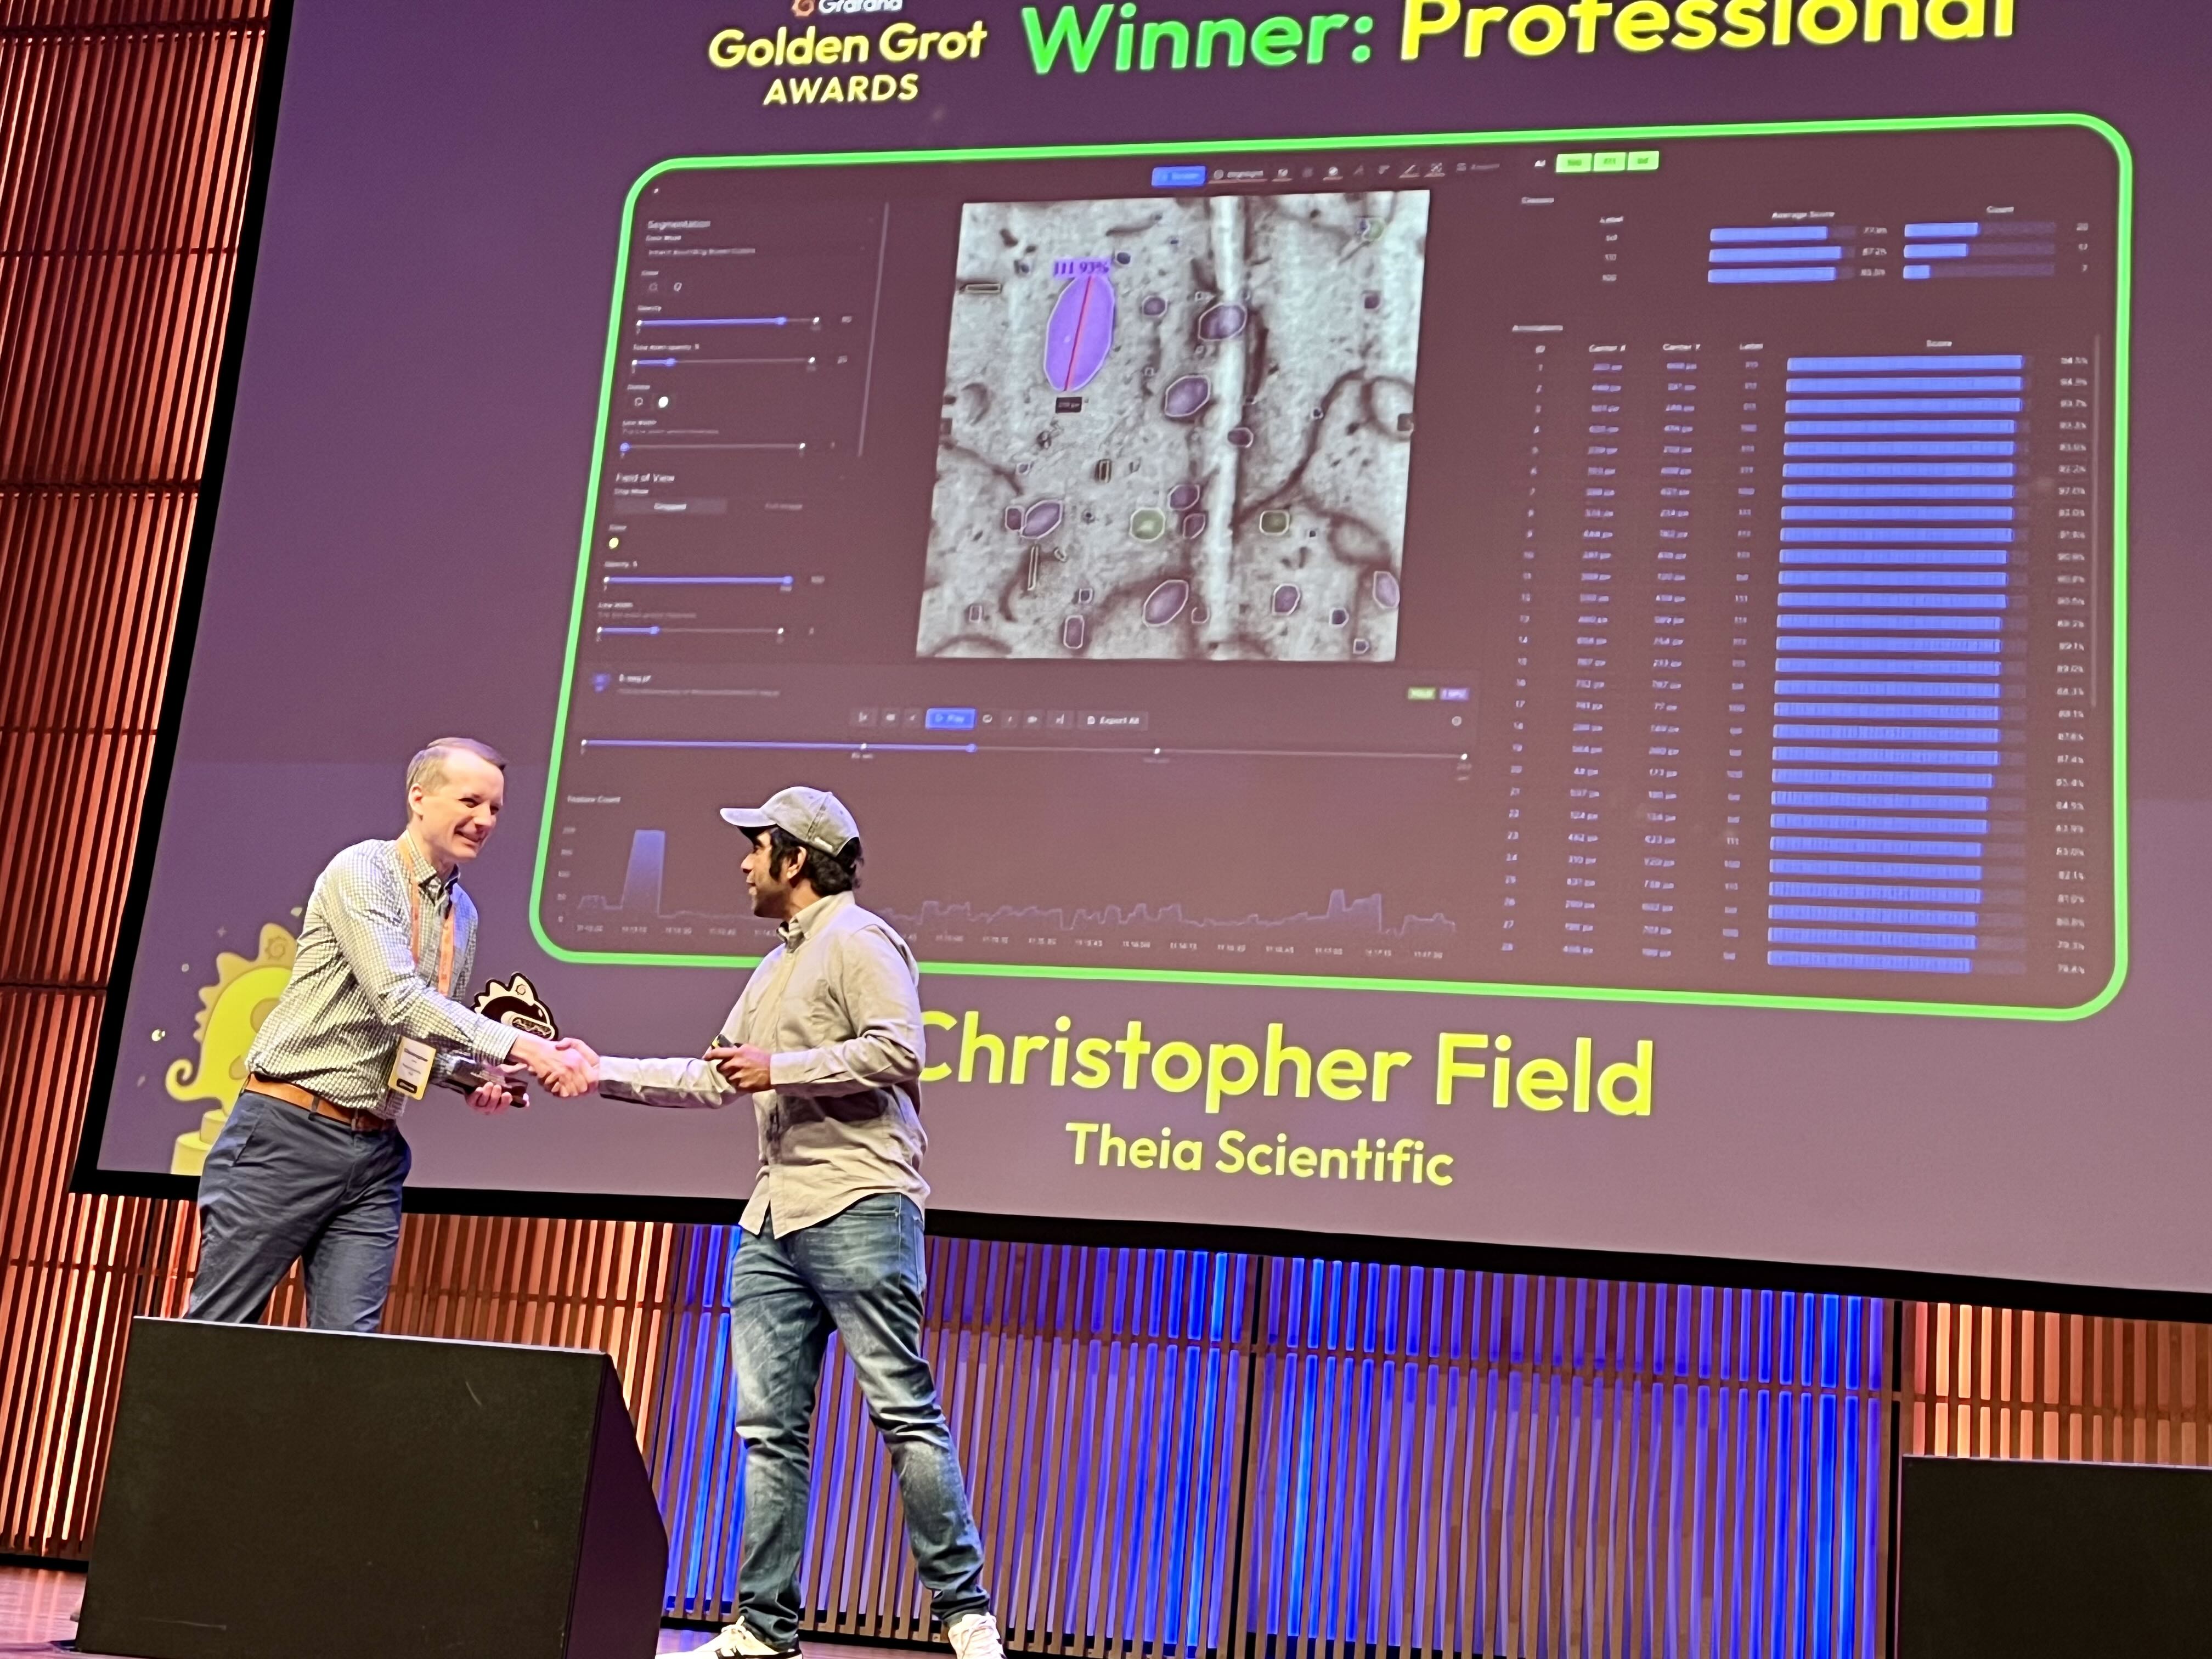
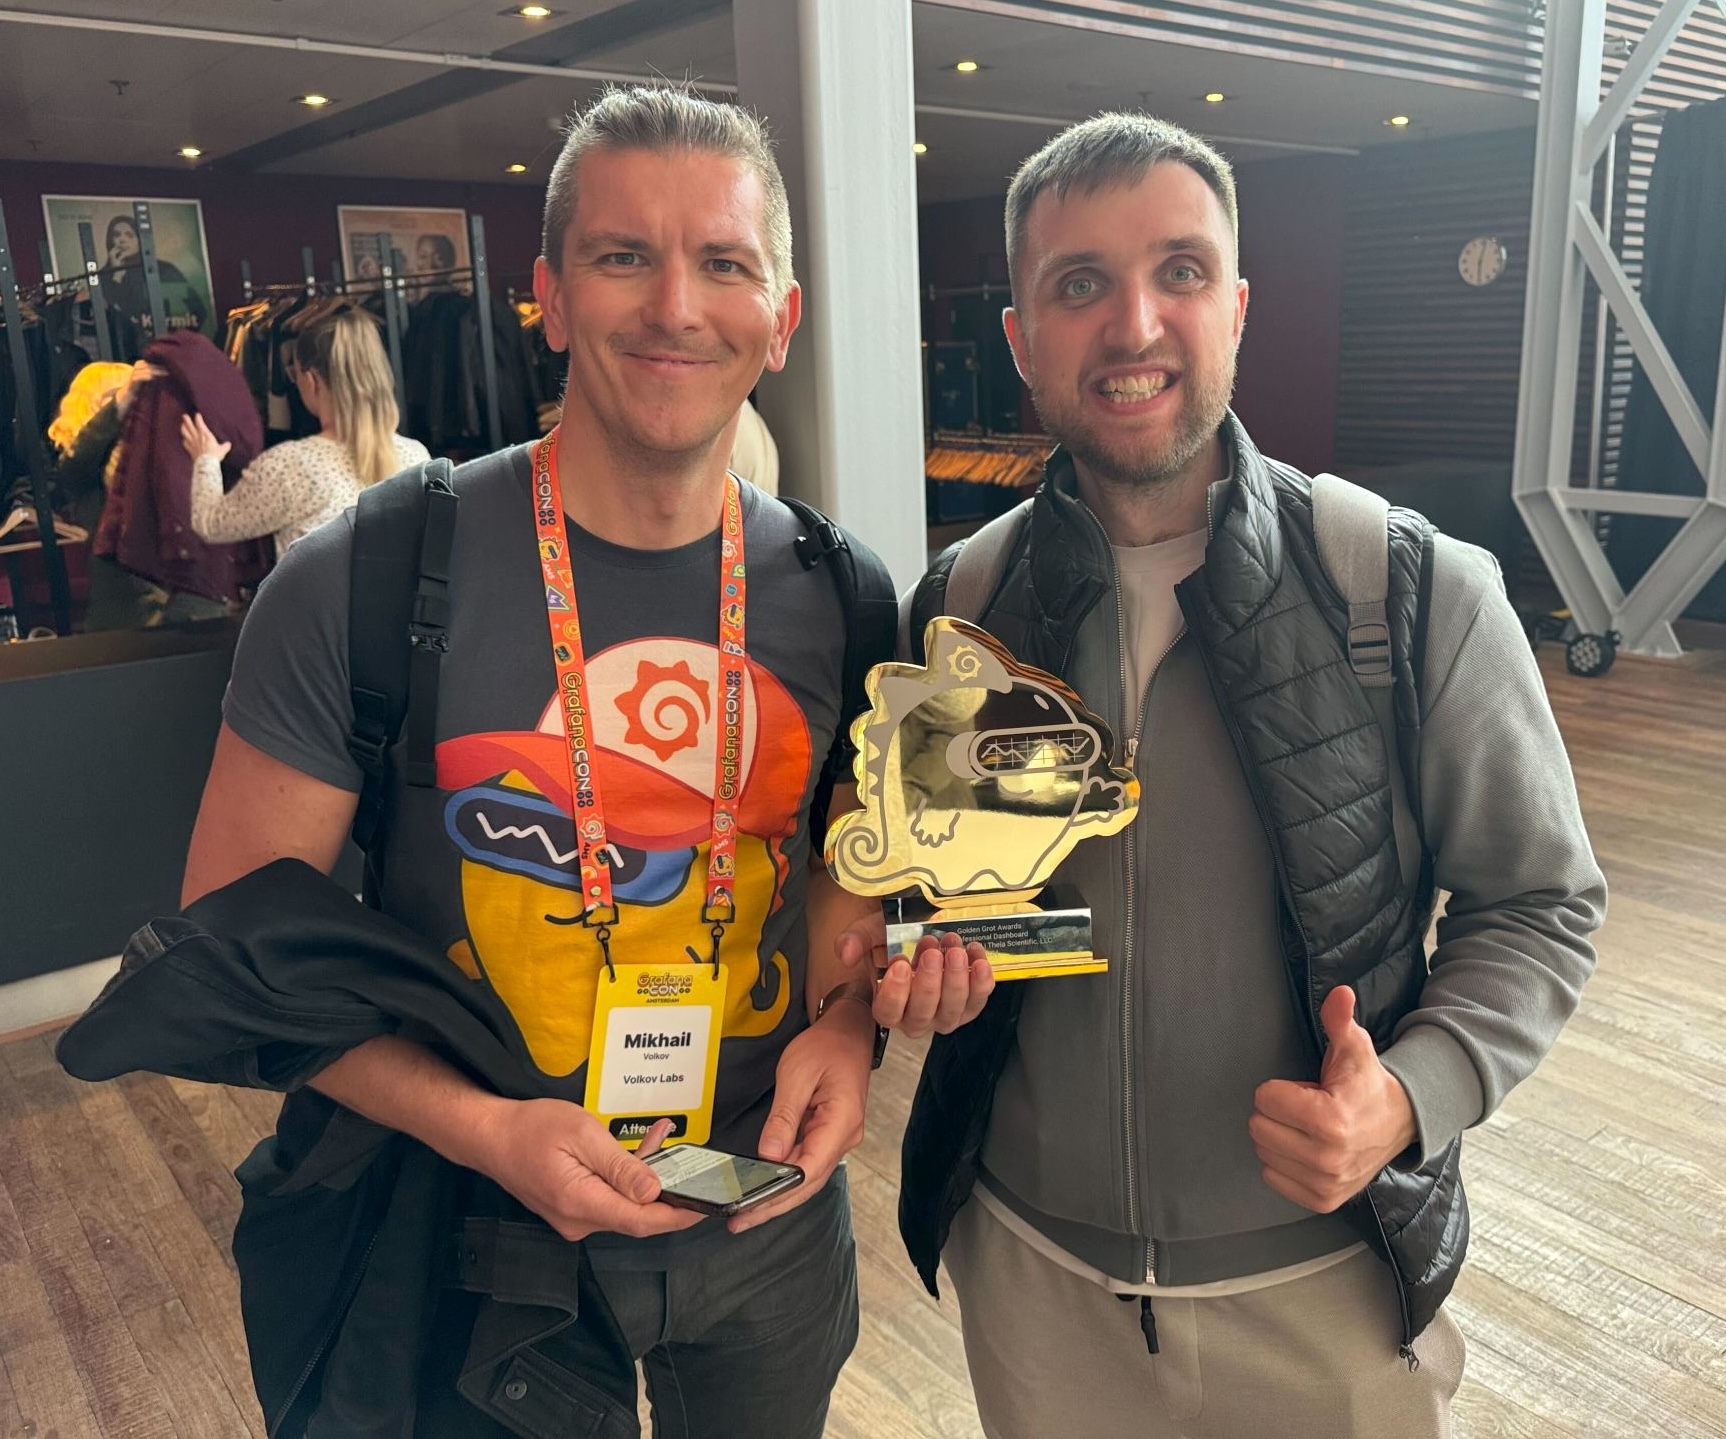
Chris generously shared the award with us for a photo op. The award itself is quite hefty and made of glassy material. It is chic and festive-looking.
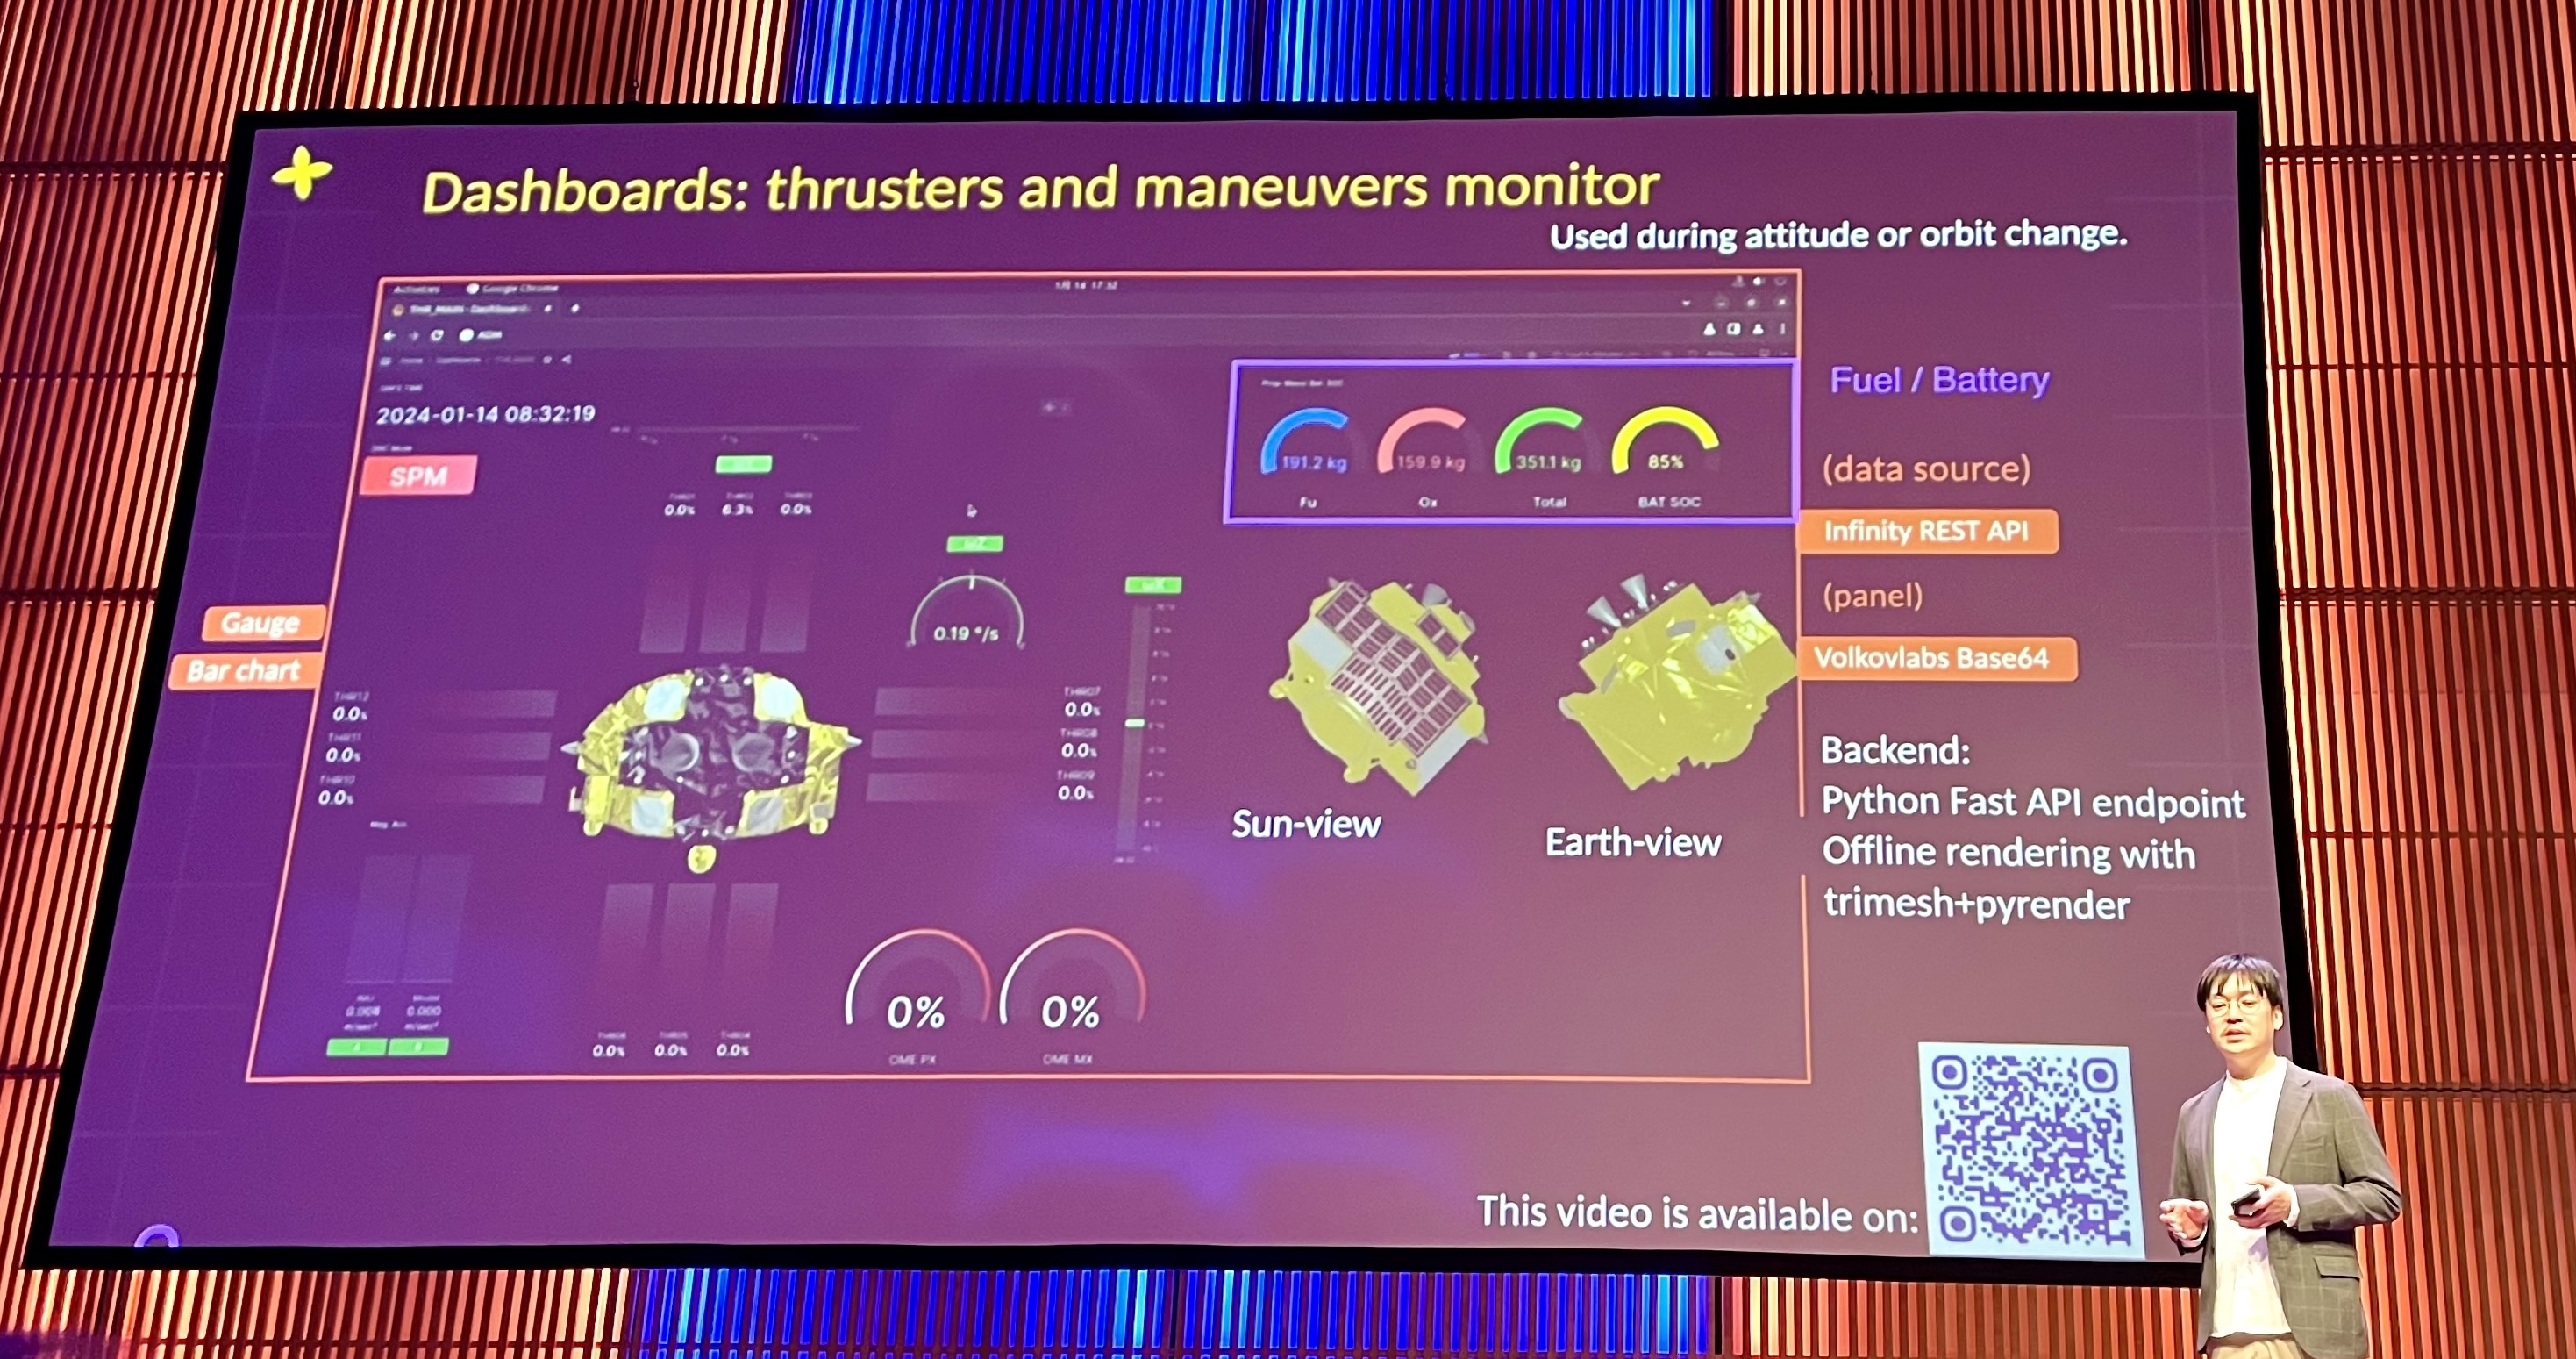
JAXA Moon landing
JAXA is the Japan Aerospace Exploration Agency. Right after the keynote session, Satoshi Nakahira, an Associate Senior Researcher, presented the Moon landing project. While listening and carefully looking at the dashboards utilized for probe monitoring, my heart skipped a bit when I saw one of our open-source plugins.
The Base64 Image plugin was featured right there on the screen and was chosen to monitor the probe movements in real time.
Planted
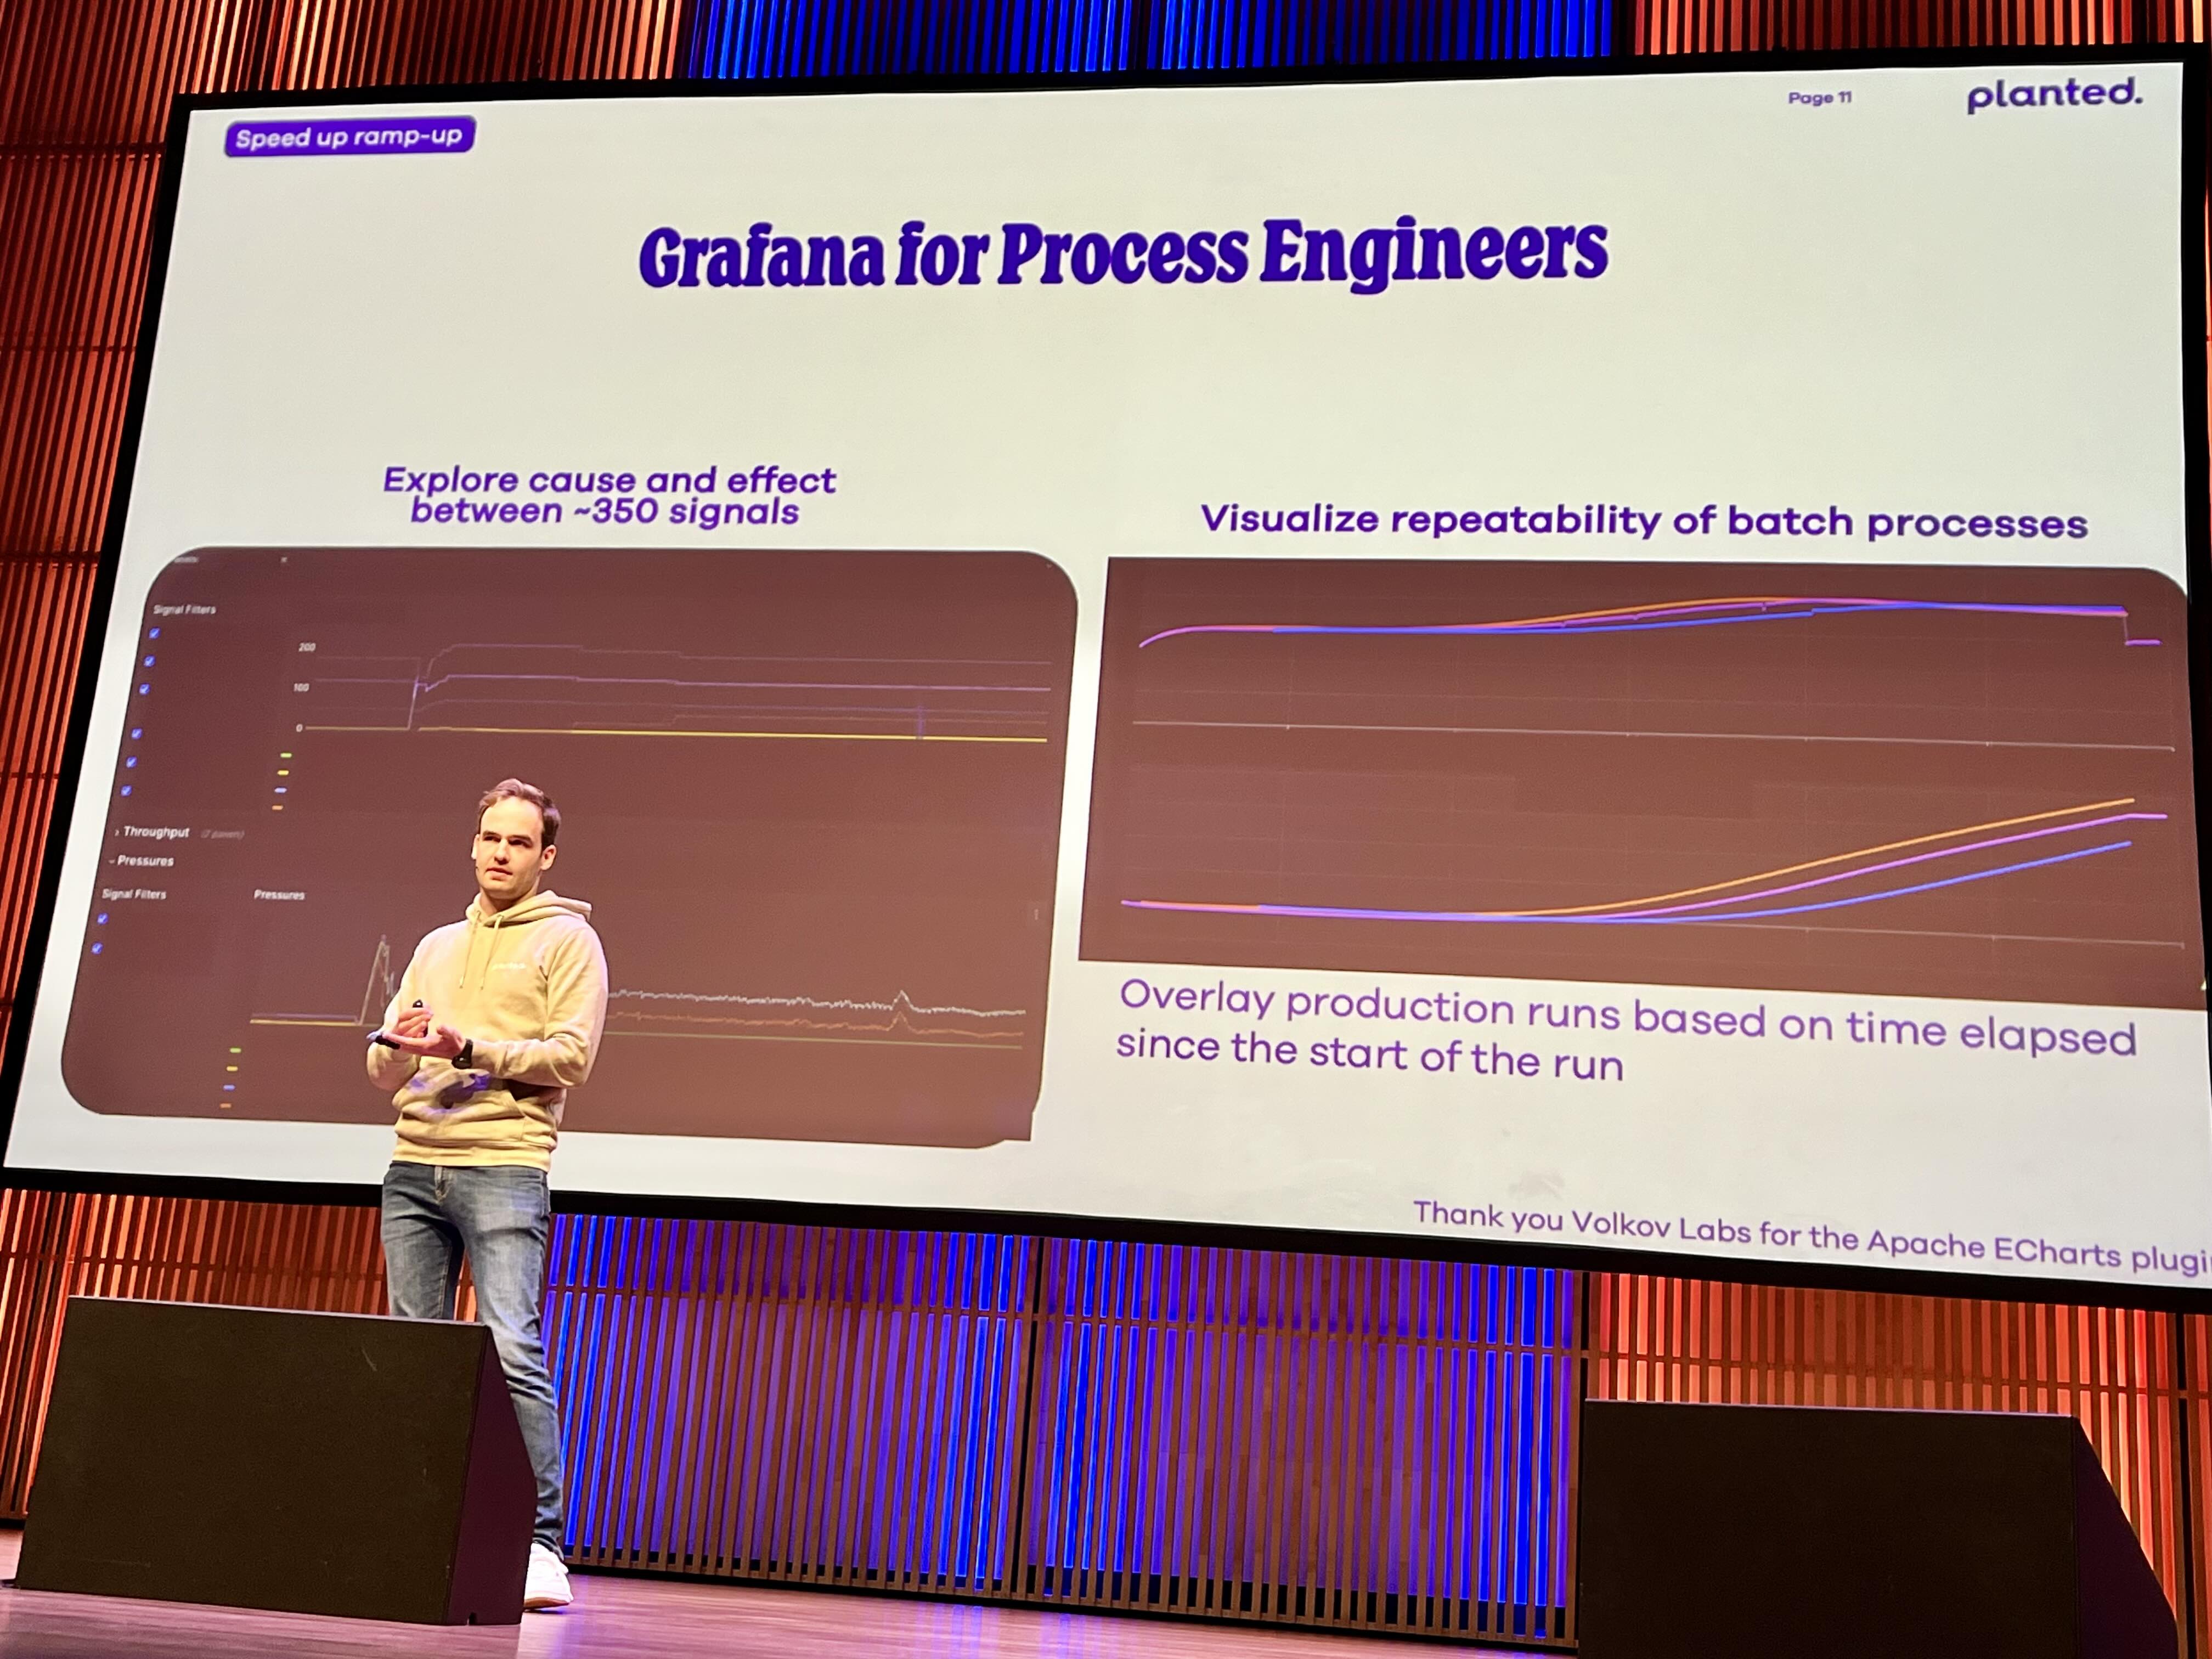
After lunch and the following Grafana 11 deep-dive session, Mathias Pawlowsky, Head of Data Science at Planted, presented how they use Grafana and, what was particularly significant for Volkov Labs.
Mathias deployed our Data Manipulation, Variable and Business Charts plugins to facilitate control right from the Grafana dashboard.
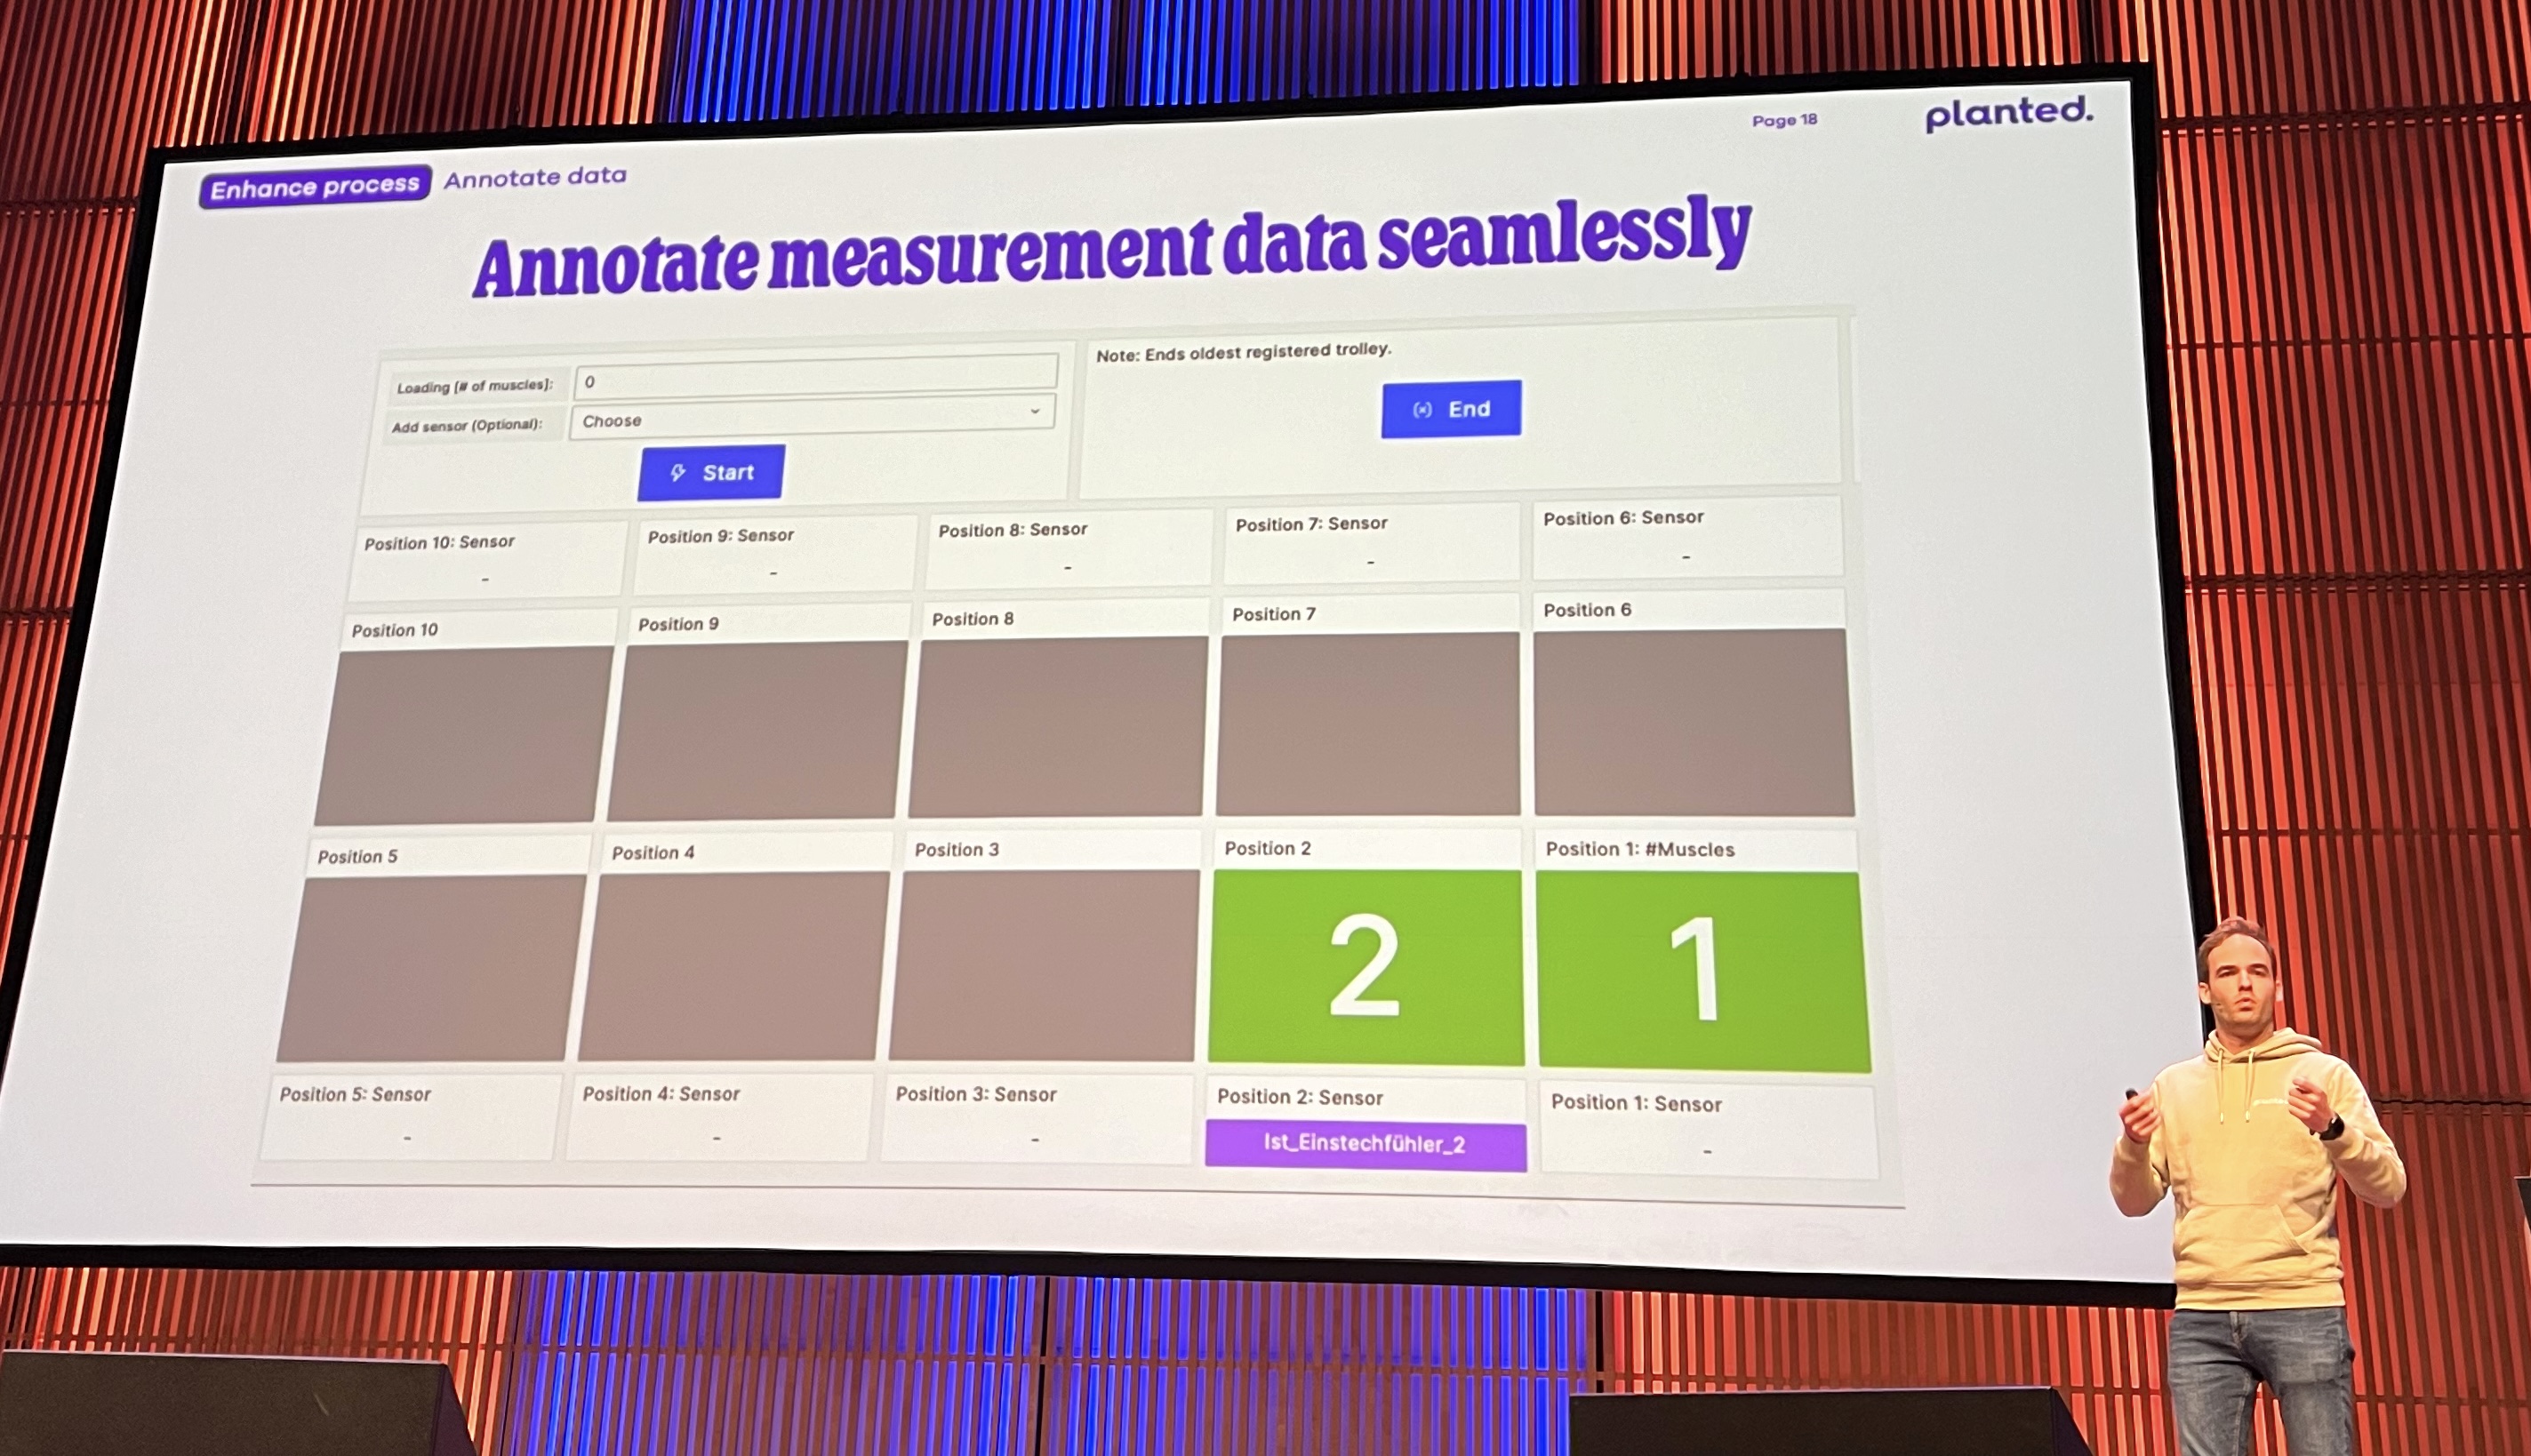
He also mentioned the concept that we advocate for, that Grafana software can go far beyond process monitoring.
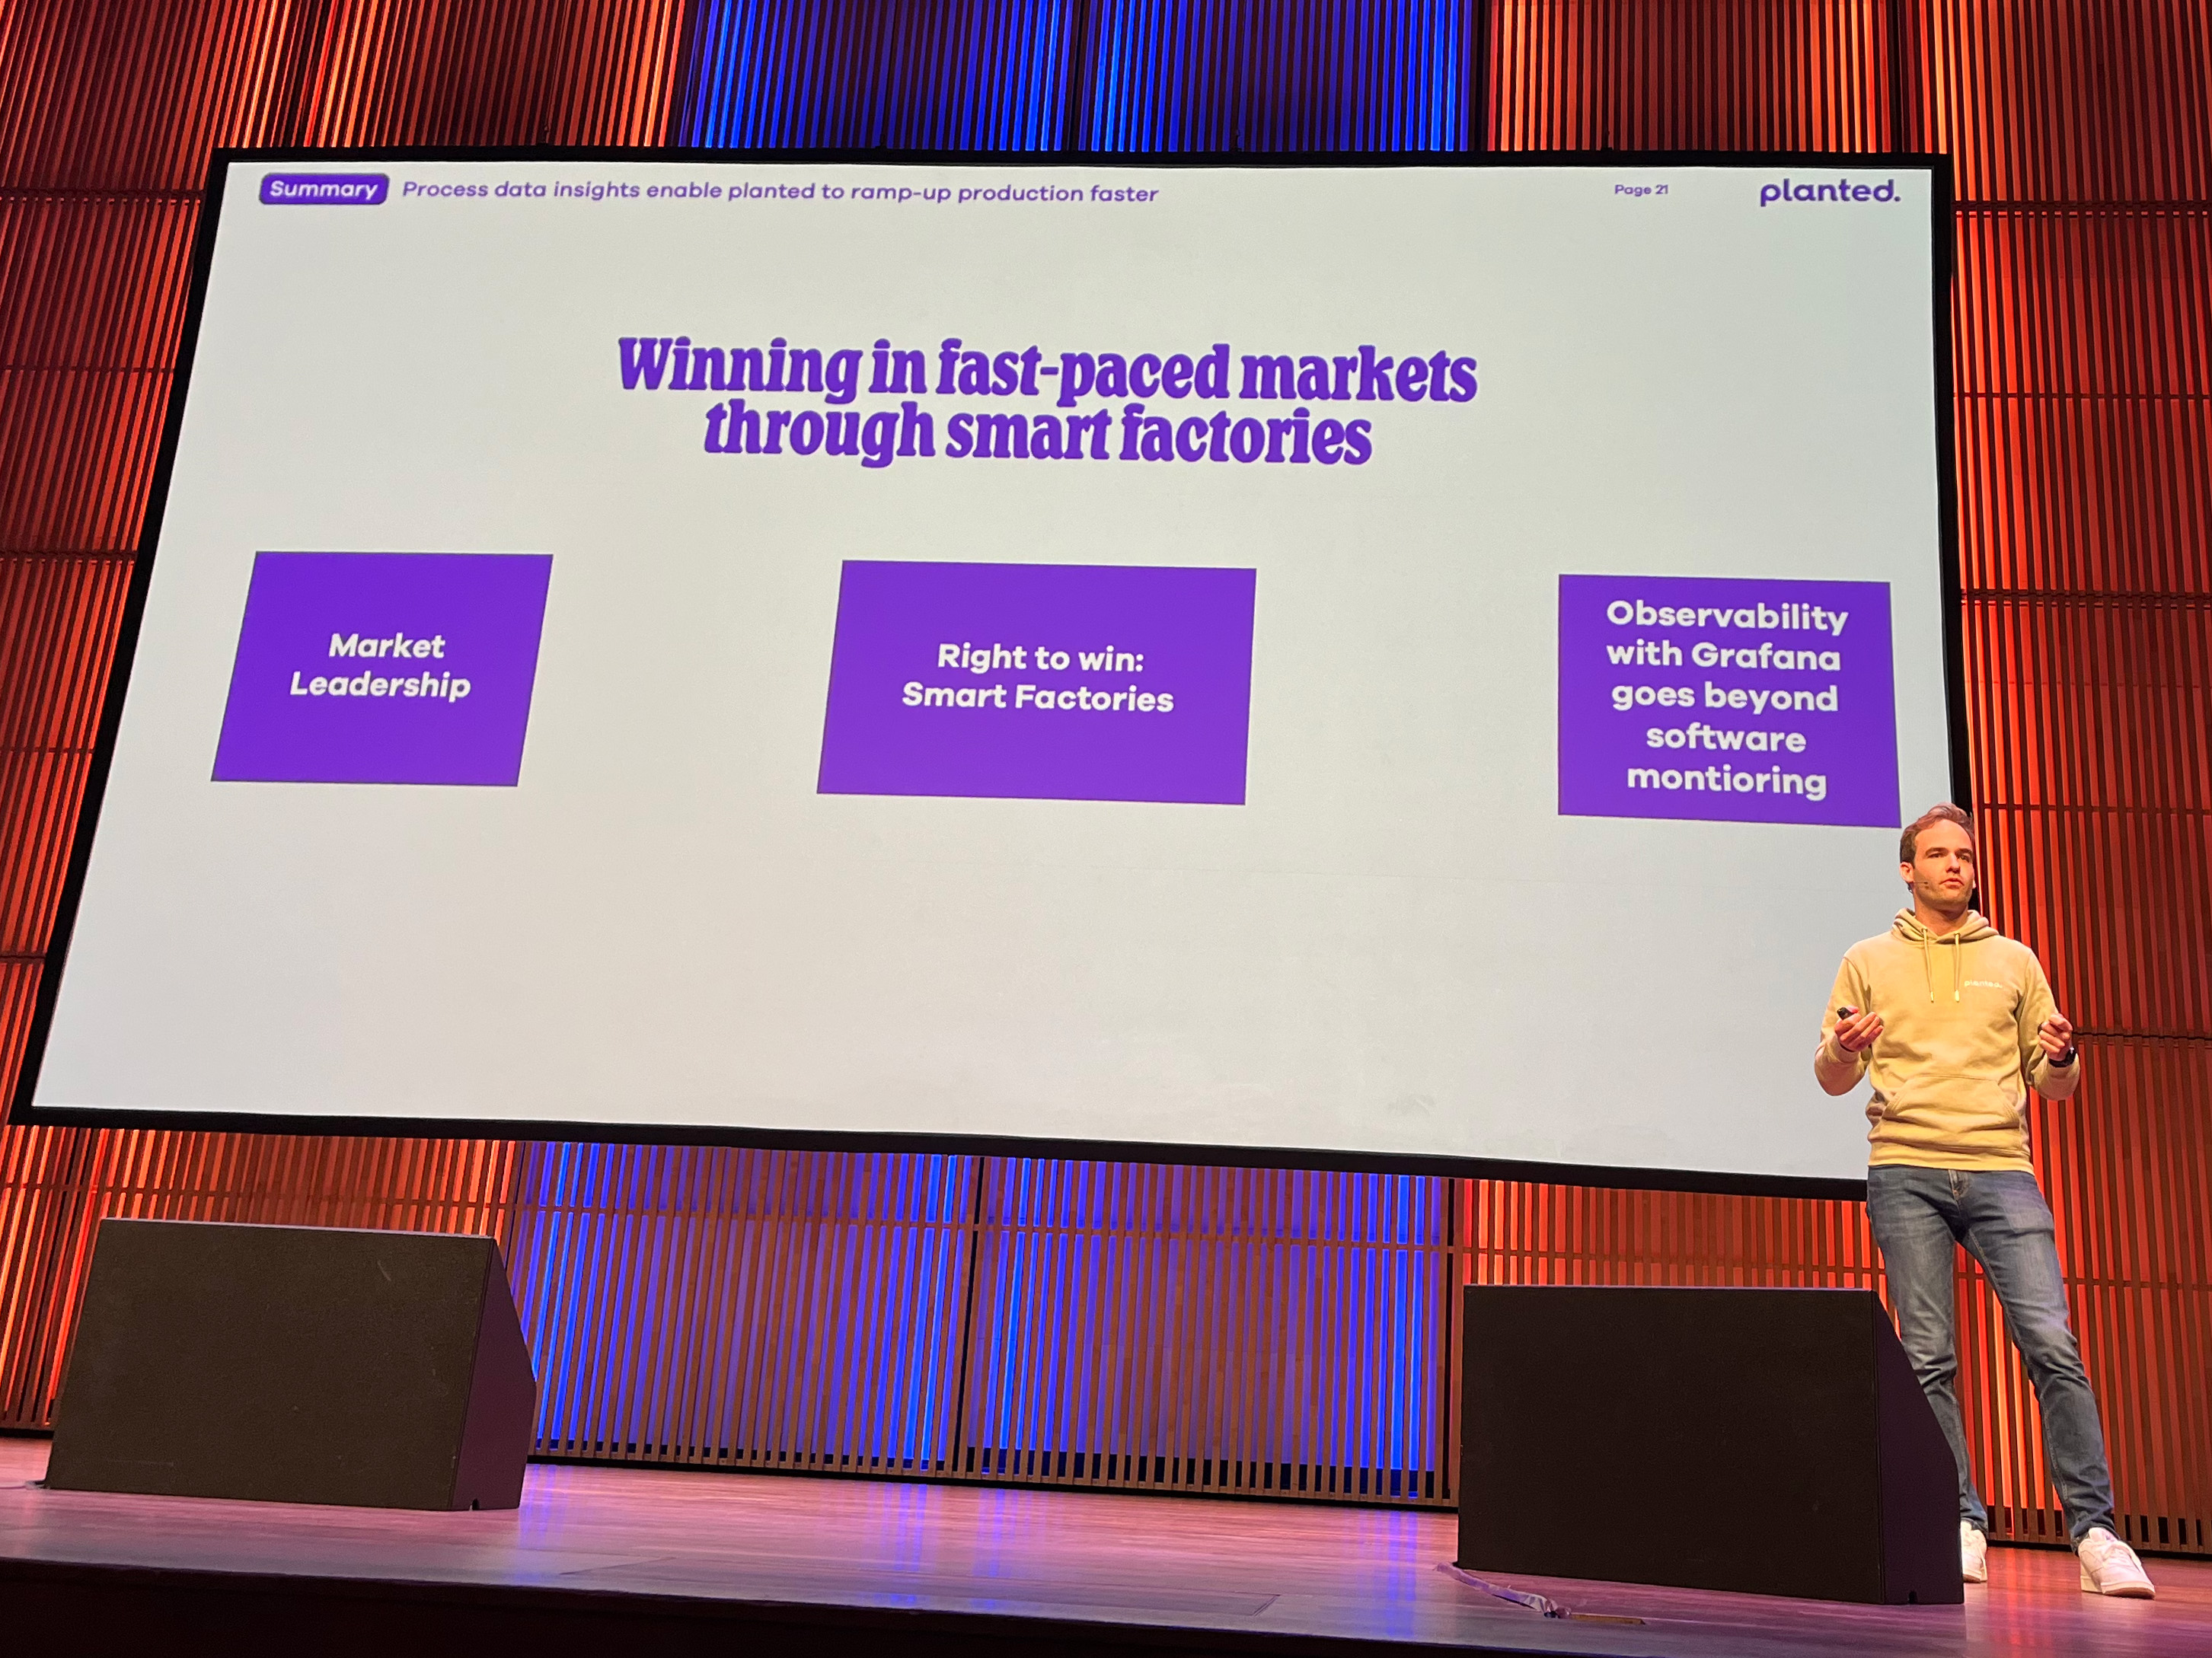
We also were humbled and excited to see the shout-out on one of his slides.
Heineken
We were excited to learn from Dolf Noordman, IIoT Engineer and Frank Van Boven, Mission Critical Engineer at Schuberg Philis company. They shared the monumental scale project with 85 Heineken breweries worldwide, all interconnected and monitored through over 4,000 Grafana dashboards.
To faciliate such a massive project they deploy customizable Grafana docker containers for each customer. Every such container includes appropriate plugins. One of the plugin they utilize is our famous Business Charts powered by Apache ECharts.
We often implement the same concept for our commercial projects. If you are interested in learning more, please refer to our blog post and YouTube videos.
Obirdability
This project was created to monitor birds. The presentation was as impressive as it was cute. Thank you for excellent work, Ivana Huckova, Senior Software Engineer and Sven Großmann, Senior Software Engineer at Grafana Labs. The team used our Dynamic Text Panel to display bird images and audio clips of bird sounds.
Thoughts on the plane flying back home
Overall, GrafanaCON 2024 was a big success! We crossed all our to-do tasks and wholeheartedly enjoyed meeting new people, the atmosphere, and the food.
We are coming back home energized and inspired. Our brains are set into brainstorming mode with new ideas for improvements and innovations. Thank you, GrafanaCON for a perfect mixture of technology and human interaction.
The Grafana community consists of technology enthusiasts who do not like corporate mazes and are after simple and straightforward solutions that are lightweight, easy to maintain, and fast to implement.
Shout out
Shout out to Amanda V. Wagner for outstanding organizational skills and for helping Grafana champions all the way.