In this weekend's project, we found a way to collect and visualize the content metrics for our website. Who, What, and from Where requested our resources, like our blog and documentation. To achieve this goal, we assembled Nginx, Loki, and Promtail into a pipeline to work together, showing all required metrics on a Grafana dashboard.
If you google how to collect Nginx logs using Promtail and Loki, you most likely will find various dashboards, outdated GitHub repositories, and other fragments of information. None of them represent a solution as a whole, covering all steps from collecting to visualizing.
Google Analytics
Initially, we used Google Analytics to track activities on our website. Whenever I opened it, I wanted to close it. Why? The interface is too cluttered with campaigns, revenue, retention, and channels. I am forced to dig through a pile of distracting information to find a single useful tidbit. Yet, even after spending time configuring existing custom dashboards and reports, one vital piece was still missing: user activities.
The one that set me on this endeavor of creating story-telling analytics, to begin with. User activities are often blocked on firewalls, security, and VPN devices. All that made me look elsewhere, surfacing a simple idea of collecting user activities directly from the web server. That approach will help to keep the essential data.
Log flow
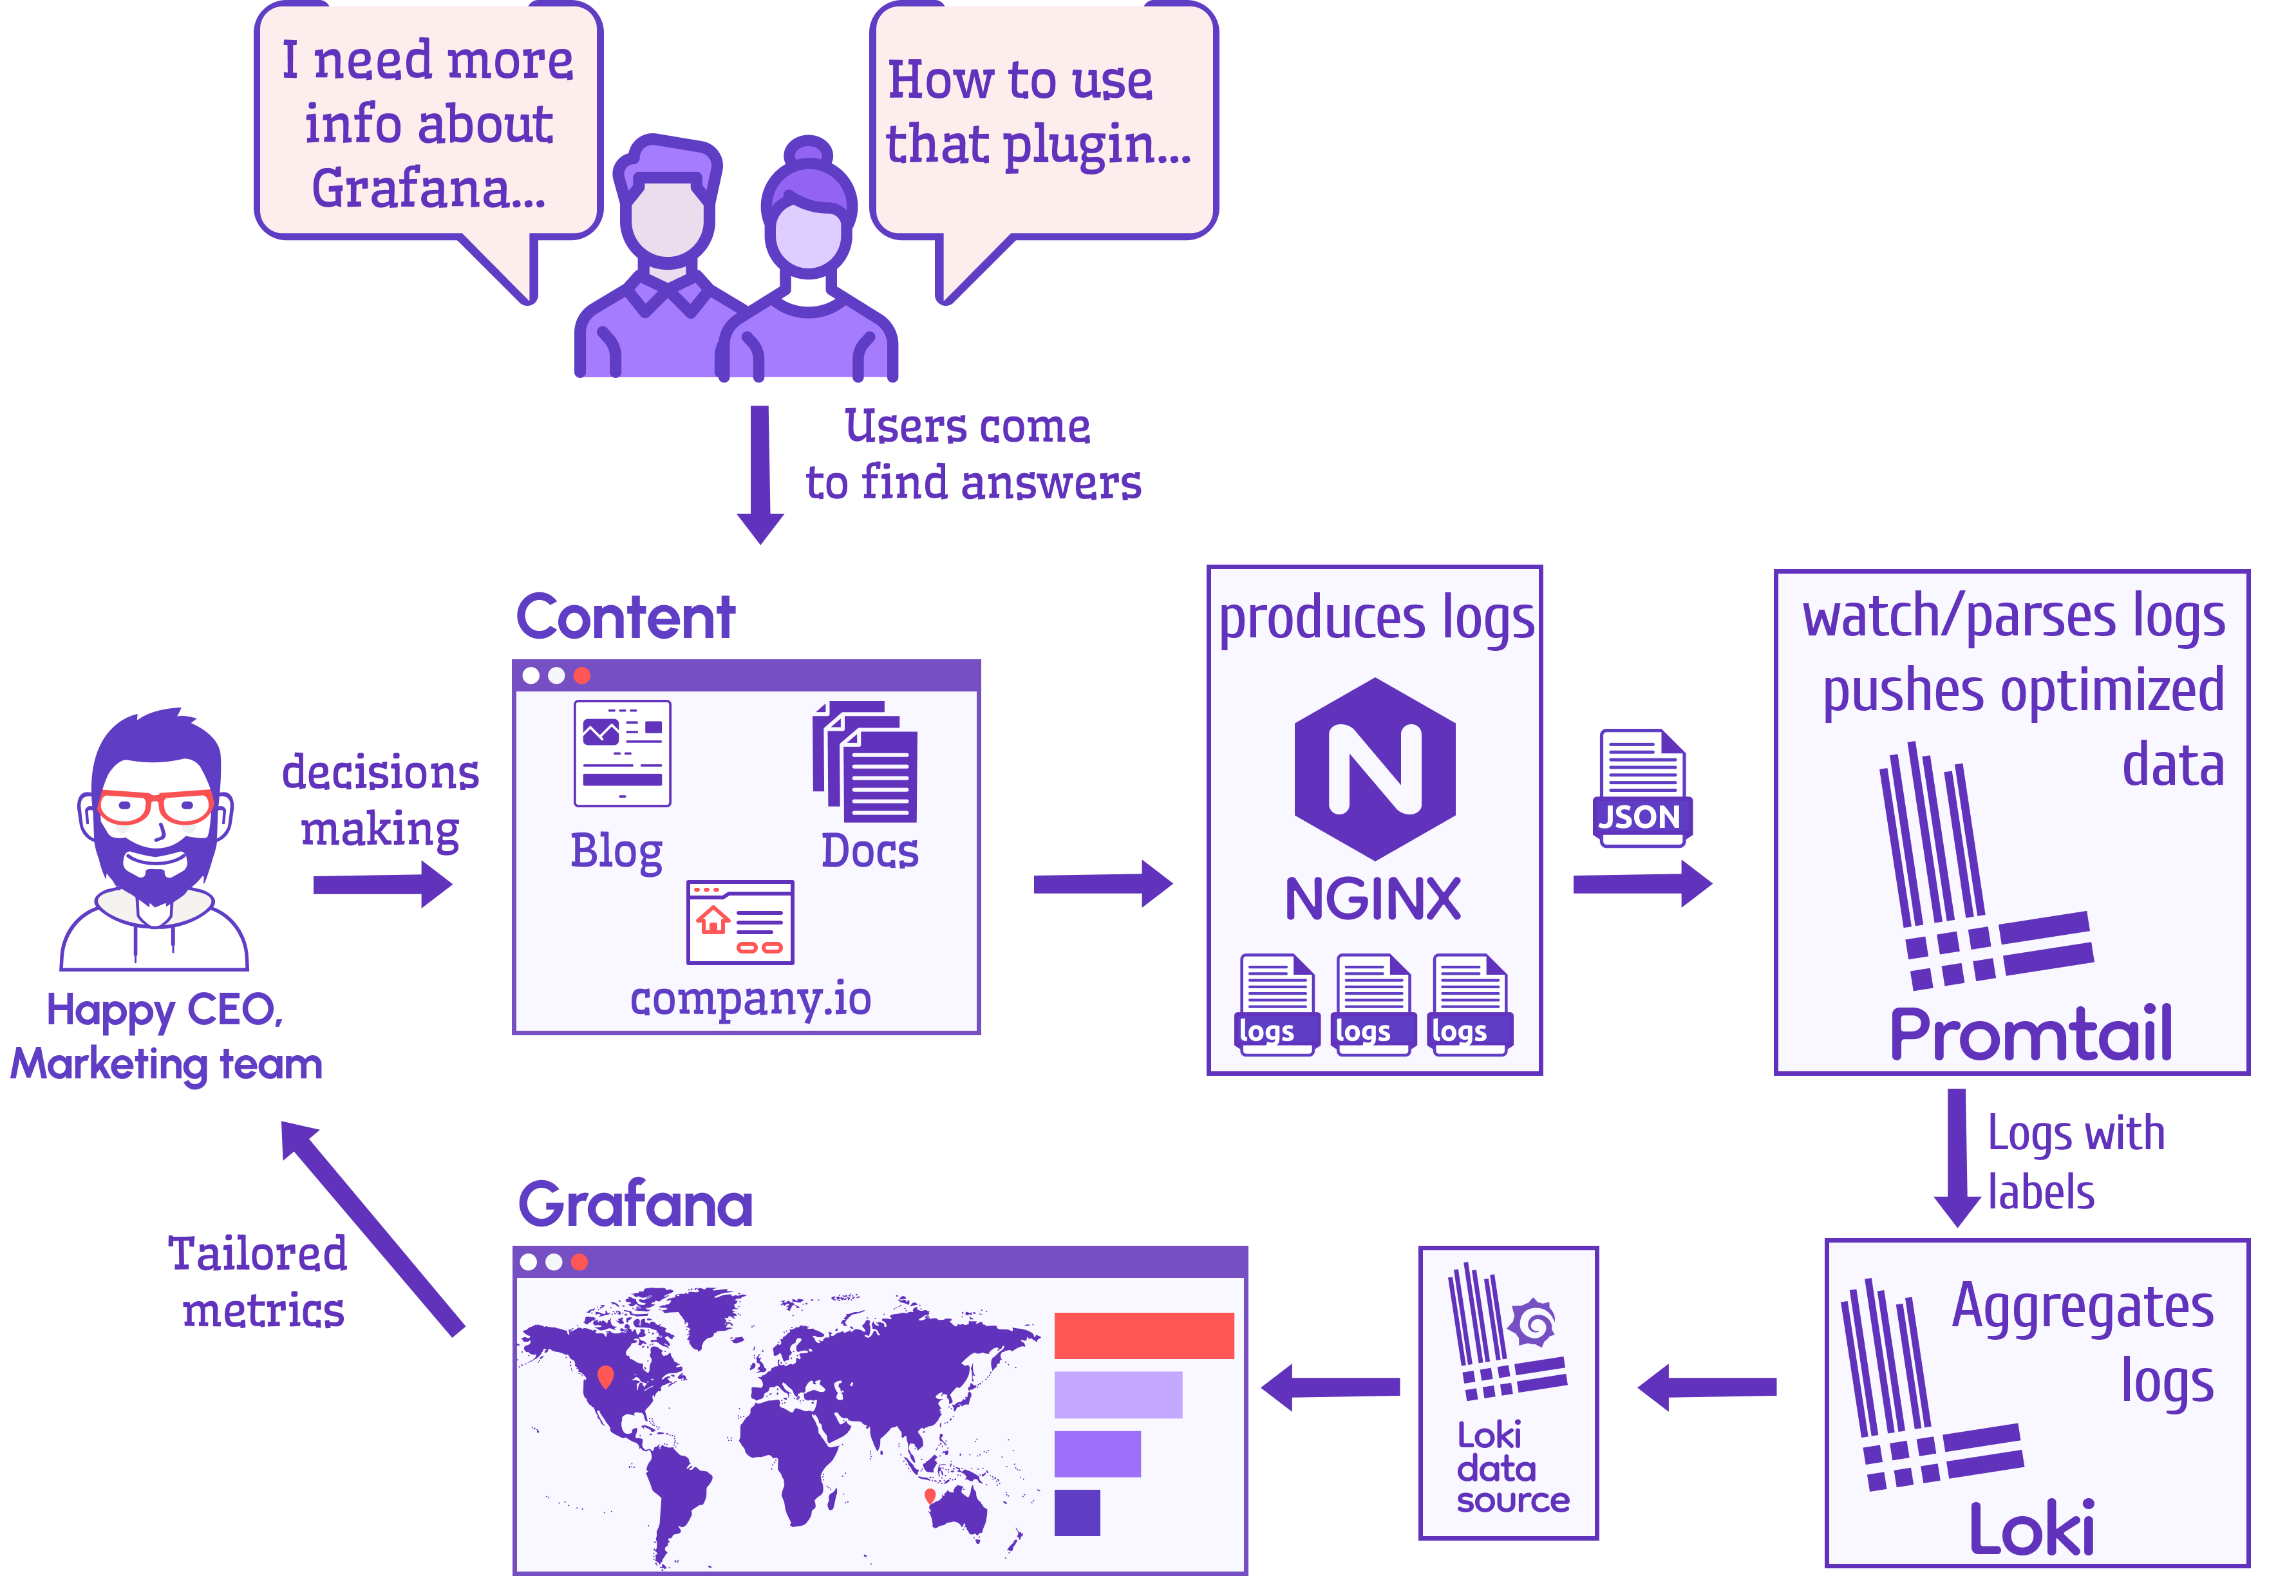
Below is the schema of the system we came up with. It illustrates what pieces come together in our puzzle and the data flow.
Let's examine each component's functions and take a closer look at each one.
- Nginx serves the website and produces log files.
- Promtail collects, and processes log files from Nginx and pushes them to Loki.
- Loki aggregates log files.
- Grafana displays content metrics along with some technical details. The data comes from Loki via the Loki data source.
Nginx
Nginx is a web server that can be a reverse proxy, load balancer, and cache. We use it in front of all our projects. For optimal performance, we chose to install it on the host.
Nginx configuration allows you to choose the data elements you want to store. You can keep everything and gift yourself a pass to think later about what you will do with all that data. On the downside of this, the volume of data snowballs. Are you willing to take on the extra task of keeping everything up and running?
From the beginning of this project, I had a clear vision of what data elements are required. Therefore, our minimalist set of cherry-picked variables are:
| Variable | Description |
|---|---|
time_local | Local time. |
remote_addr | Client IP. |
request_uri | Full path and arguments for the request. |
status | Response status code. |
http_referer | HTTP referer. |
http_user_agent | HTTP clients - user agents. |
server_name | The name of the server handling the request. |
request_time | Request processing time in seconds with msec resolution. |
geoip_country_code | Geo location based on client IP. |
We also added additional configuration to the main configuration file nginx.conf to get as clean input data as possible and avoid further processing in Promtail and Grafana.
- Replace empty values in
http_refererwith(direct)similar to Google Analytics. - Replace empty values in
http_user_agentwithUnknown. - Replace empty values in
geoip_country_codewithUnknown. - Use preinstalled Geo IP database
/usr/share/GeoIP/GeoIP.dat. - Add
json_analyticslogging JSON format with provided variables, which we will use for server blocks.
loading...
A produced JSON record from the log file looks like this.
{
  "time_local": "29/Jan/2023:02:57:08 +0000",
  "remote_addr": "111.222.334.444",
  "request_uri": "/plugins/volkovlabs-form-panel/request/",
  "status": "200",
  "http_referer": "(direct)",
  "http_user_agent": "Mozilla/5.0",
  "server_name": "volkovlabs.io",
  "request_time": "0.000",
  "geoip_country_code": "CZ"
}
Geo IP database
A Geo IP database is a database of IP addresses with their locations tagged, which we use in Nginx to perform geolocation using an IP address.
Preinstalled Geo IP database on our Linux server is outdated, but works great for this project and does not require additional configuration. To be able to do geolocation, Nginx should have the module ngx_http_geoip_module enabled.
/usr/share/GeoIP# ls -lrt
total 7912
-rw-r--r-- 1 root root 6426573 Nov  8  2018 GeoIPv6.dat
-rw-r--r-- 1 root root 1672893 Nov  8  2018 GeoIP.dat
Modern GeoIP2 database can be used instead of outdated Geo IP. It requires:
- Set up an account.
- Additional configuration for daily updates.
- Compile Nginx with an additional module supporting GeoIP2.
You can easily find instructions on how to do it and go this route if required.
Server configuration
Server blocks in Nginx can be used to encapsulate configuration details and host more than one domain on a single server. In the configuration file for the website we added additional logging in the file analytics.log using discussed JSON format.
server {
  access_log /var/log/nginx/analytics.log json_analytics;
}
Loki
Loki is a horizontally scalable, highly available, multi-tenant log aggregation system inspired by Prometheus. It does not index the contents of the logs, but rather a set of labels for each log stream.
In our environment we are running Loki in a Docker container orchestrated using docker-compose.
- The data folder
/lokistored in the volume folder on a local drive. - Configuration file
/etc/loki/local-config.yamlstored in thelokifolder next to the data. - Uses the latest stable version
2.8.0.
  loki:
    container_name: loki
    image: grafana/loki:2.8.0
    restart: always
    network_mode: host
    volumes:
      - ./loki/data:/loki
      - ./loki/loki.yml:/etc/loki/local-config.yaml
Loki, Promtail, and Grafana containers are distributed on separate hosts, and we run them in the network host mode.
Configuration
The configuration file is based on the default file shipped with the 2.7.1 release. We updated the configuration to increase the number of maximum outstanding requests to accommodate the Grafana dashboard.
loading...
You can learn more about Loki configuration in the Documentation.
Promtail
Promtail is an agent which ships the contents of local logs to a private Grafana Loki instance. It is usually deployed to every machine that has applications needed to be monitored.
Similar to Loki we are running Promtail in a Docker container orchestrated with docker-compose.
- Configuration file
/etc/promtail/config.ymlstored in thelokifolder. - The Nginx log folder
/var/log/nginxwas added to the container. - Uses the latest stable version
2.8.0.
  promtail:
    image: grafana/promtail:2.8.0
    restart: always
    container_name: promtail
    network_mode: host
    volumes:
      - ./loki/promtail.yml:/etc/promtail/config.yml
      - /var/log/nginx:/var/log/nginx
Configuration
The configuration file is based on the default file shipped with the 2.7.1 release. We updated the configuration for Nginx analytics log files to add labels job, host, and agent and watch for analytics.log files.
Promtail push logs to the Loki specified in the configuration file http://LOKI-IP:3100/loki/api/v1/push, which is located on a separate host in our configuration.
We added Pipeline stages to drop records we are not interested in.
- Requests from Googlebot, inspectors, test, network devices and RSS collectors.
- Requests for images and assets (Javascript, CSS) in the special folders.
- Requests for particular files for browsers and indexing engines.
- Malicious request from scanners to find PHP and XML files.
loading...
The Pipelines can be changed and updated based on your requirements.
Grafana
We love Grafana and use it for all our projects. We covered the installation process in the video.
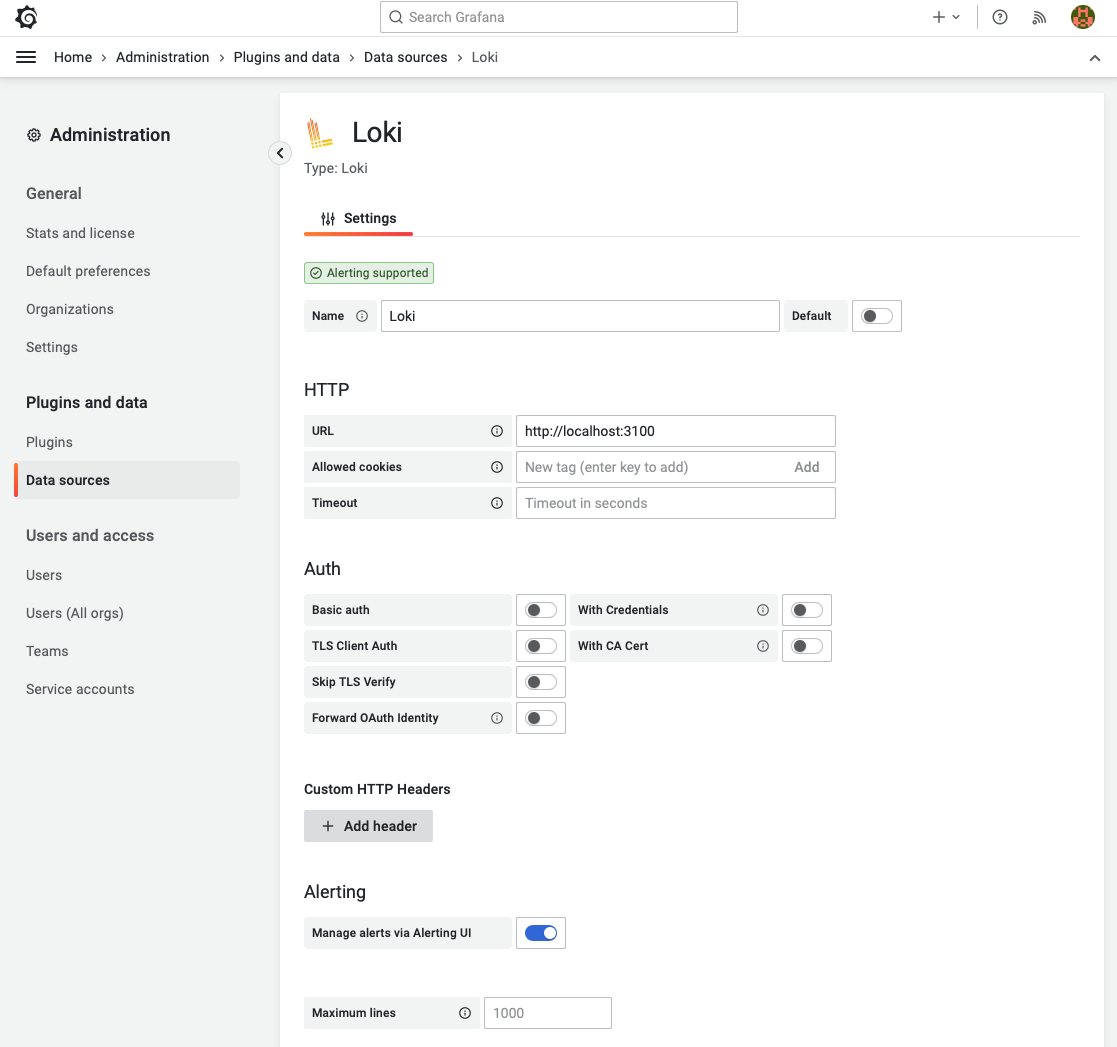
Loki data source
A Loki data source is preinstalled in Grafana. We used the URL http://localhost:3100 to connect to the private Loki instance without authorization.
Analytics Dashboard
Website Analytics dashboard was inspired by Grafana Loki Dashboard for NGINX Service Mesh, one of the most interesting and updated dashboards we can find for Nginx.
Each panel and query was updated according to our styling guidelines and requirements. In this video, Daria will guide you through the process of creating the dashboard.
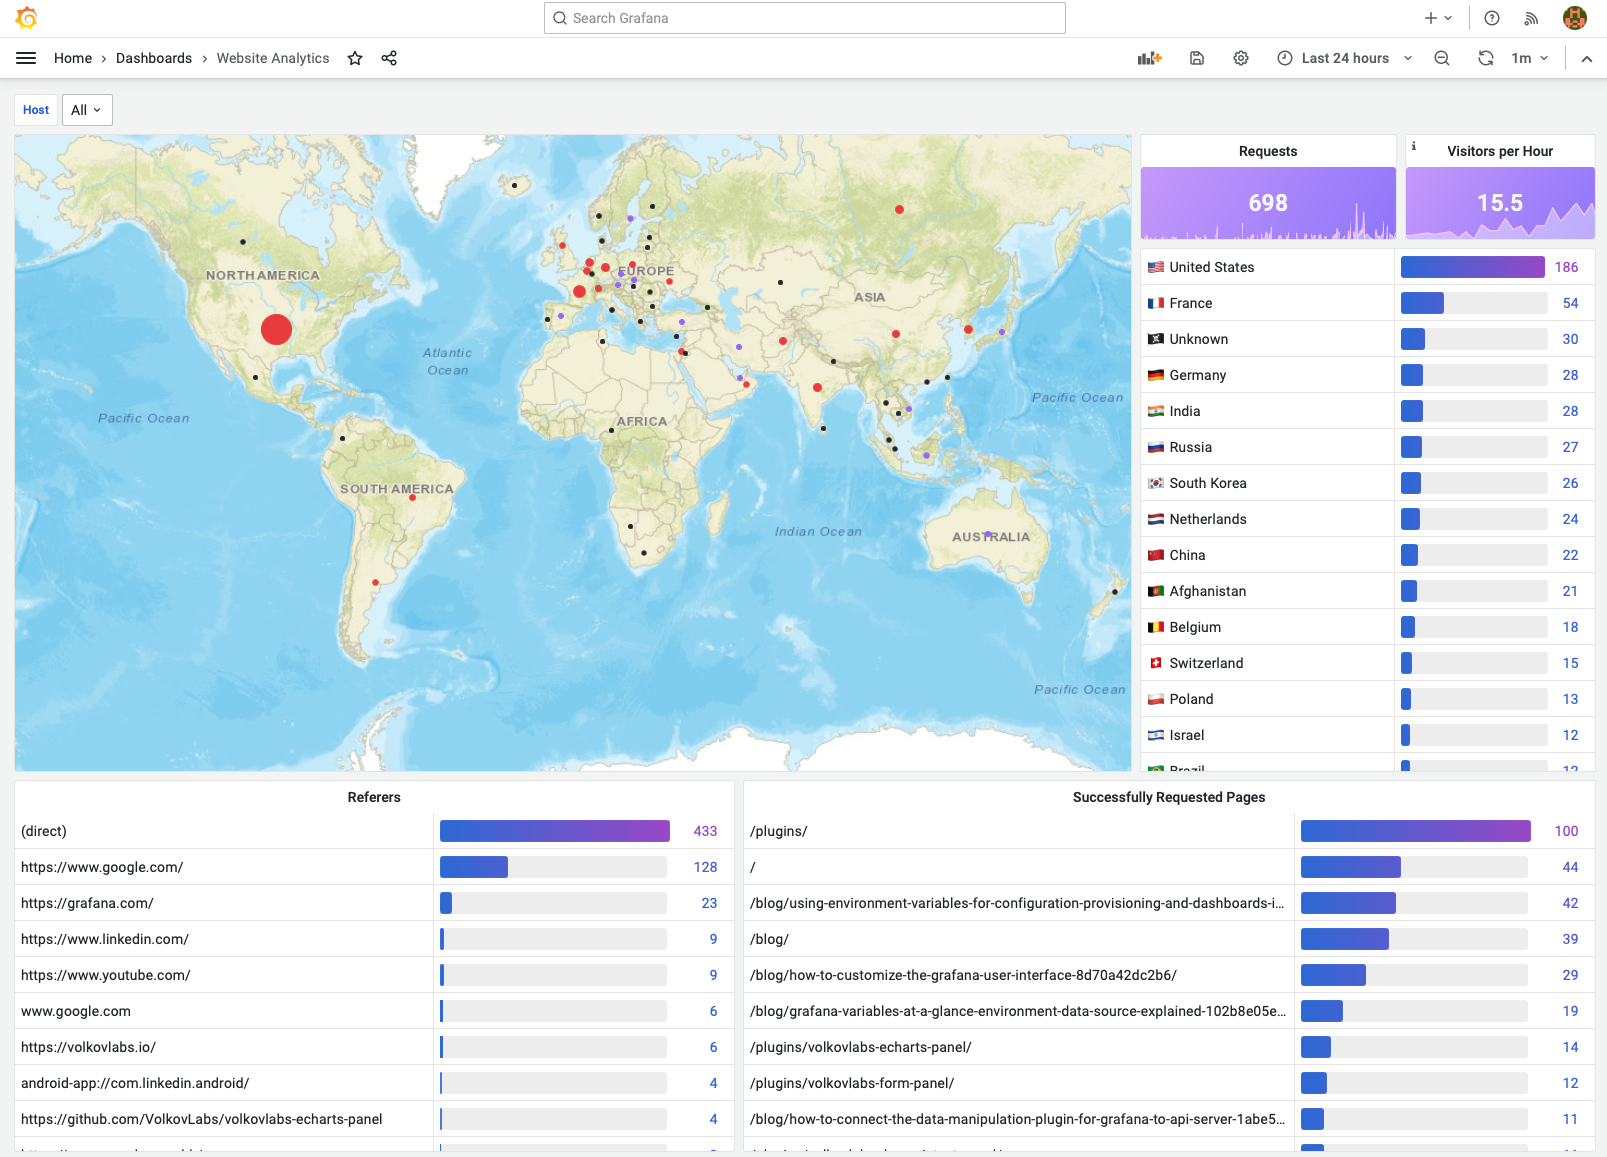
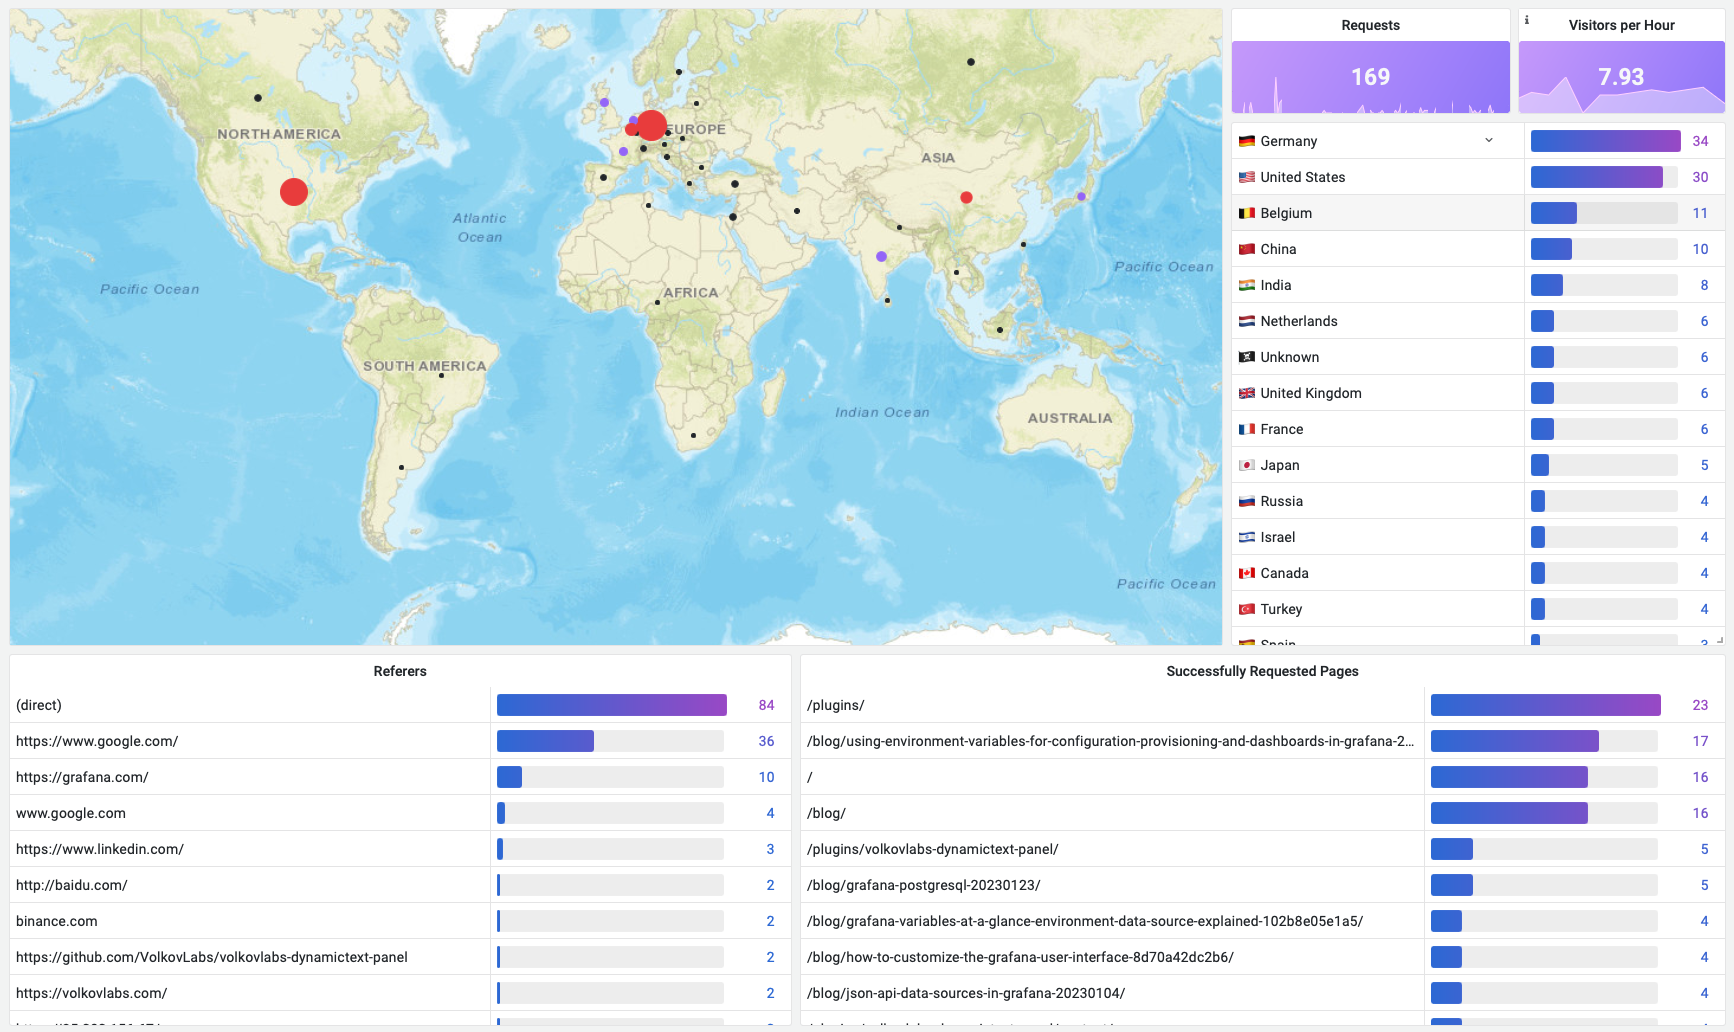
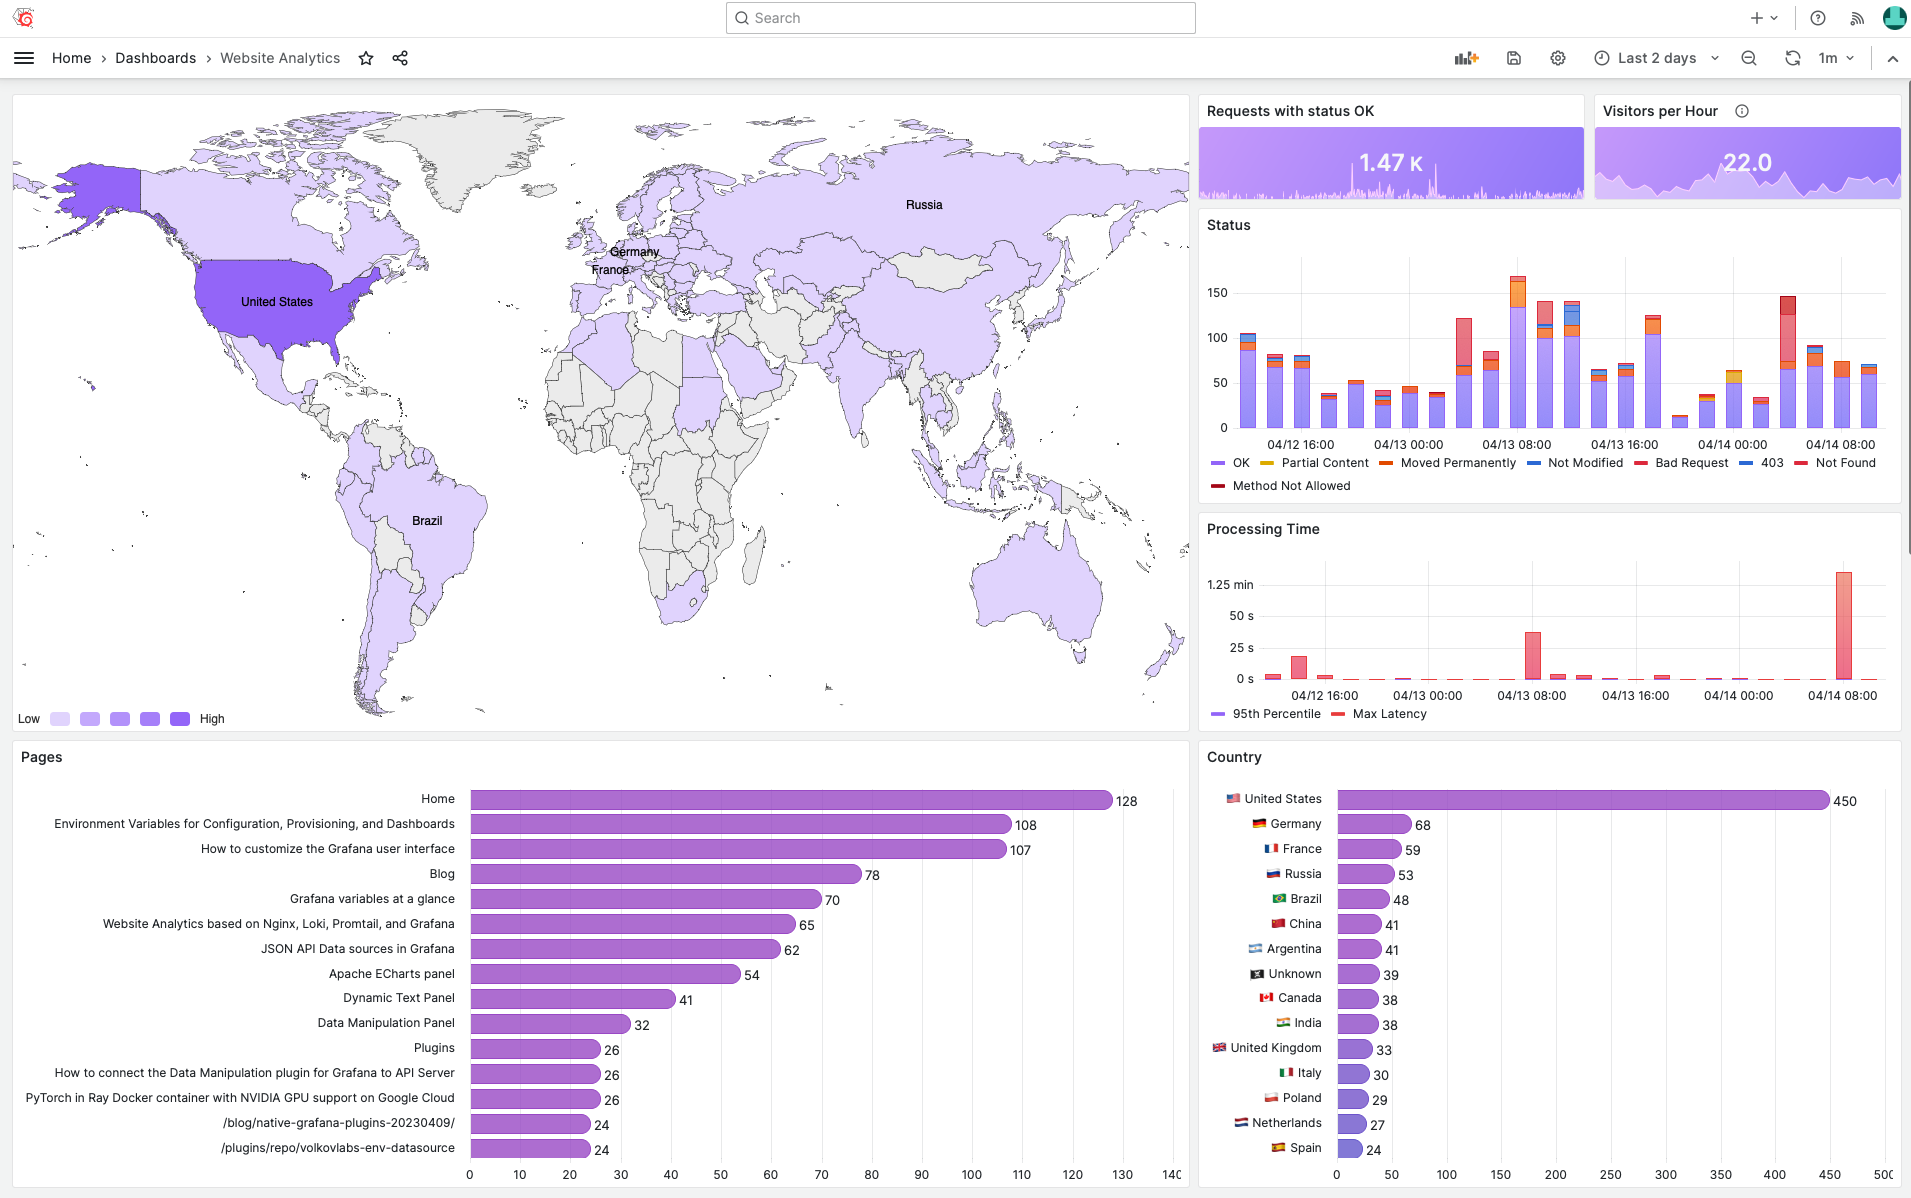
Content metrics
The first part of the dashboard provides content metrics - Who, What and from Where requested resources.
- Geomap displays a number of requests for each Geo location, except unrecognized countries replaced with
Unknown. - Requests panel displays the total number of requests in the selected Time Range.
- Visitors per Hour displays a number of unique remote IP addresses per hour.
- A list of countries as a sorted table with values mapping. The list of countries can be updated if required.
- Referers display the location from where requested resources are being used.
- Successfully Requested Pages displays the most frequently requested resources.
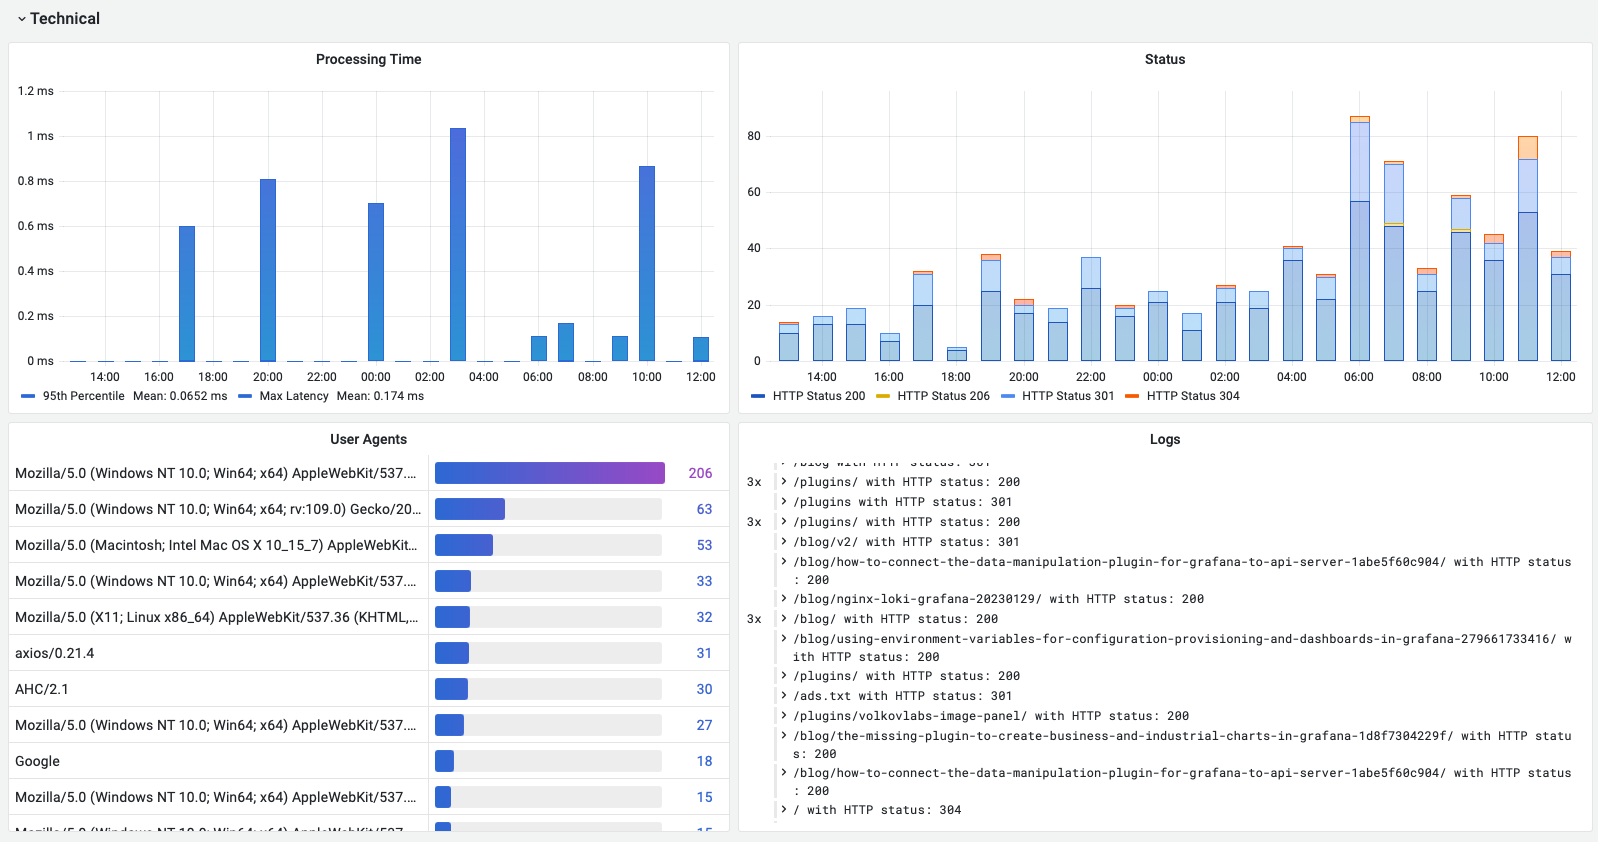
Technical metrics
The second part of the dashboard contains technical information.
- Processing Time (95th Percentile and Max latency) to diagnose any technical issues with delivering content.
- Status of the HTTP requests in 5 minutes blocks displayed as bars.
- The most frequently used User Agents with information about browsers and platforms.
- Logs to display raw logging information and verify that we are collecting only required fields and records.
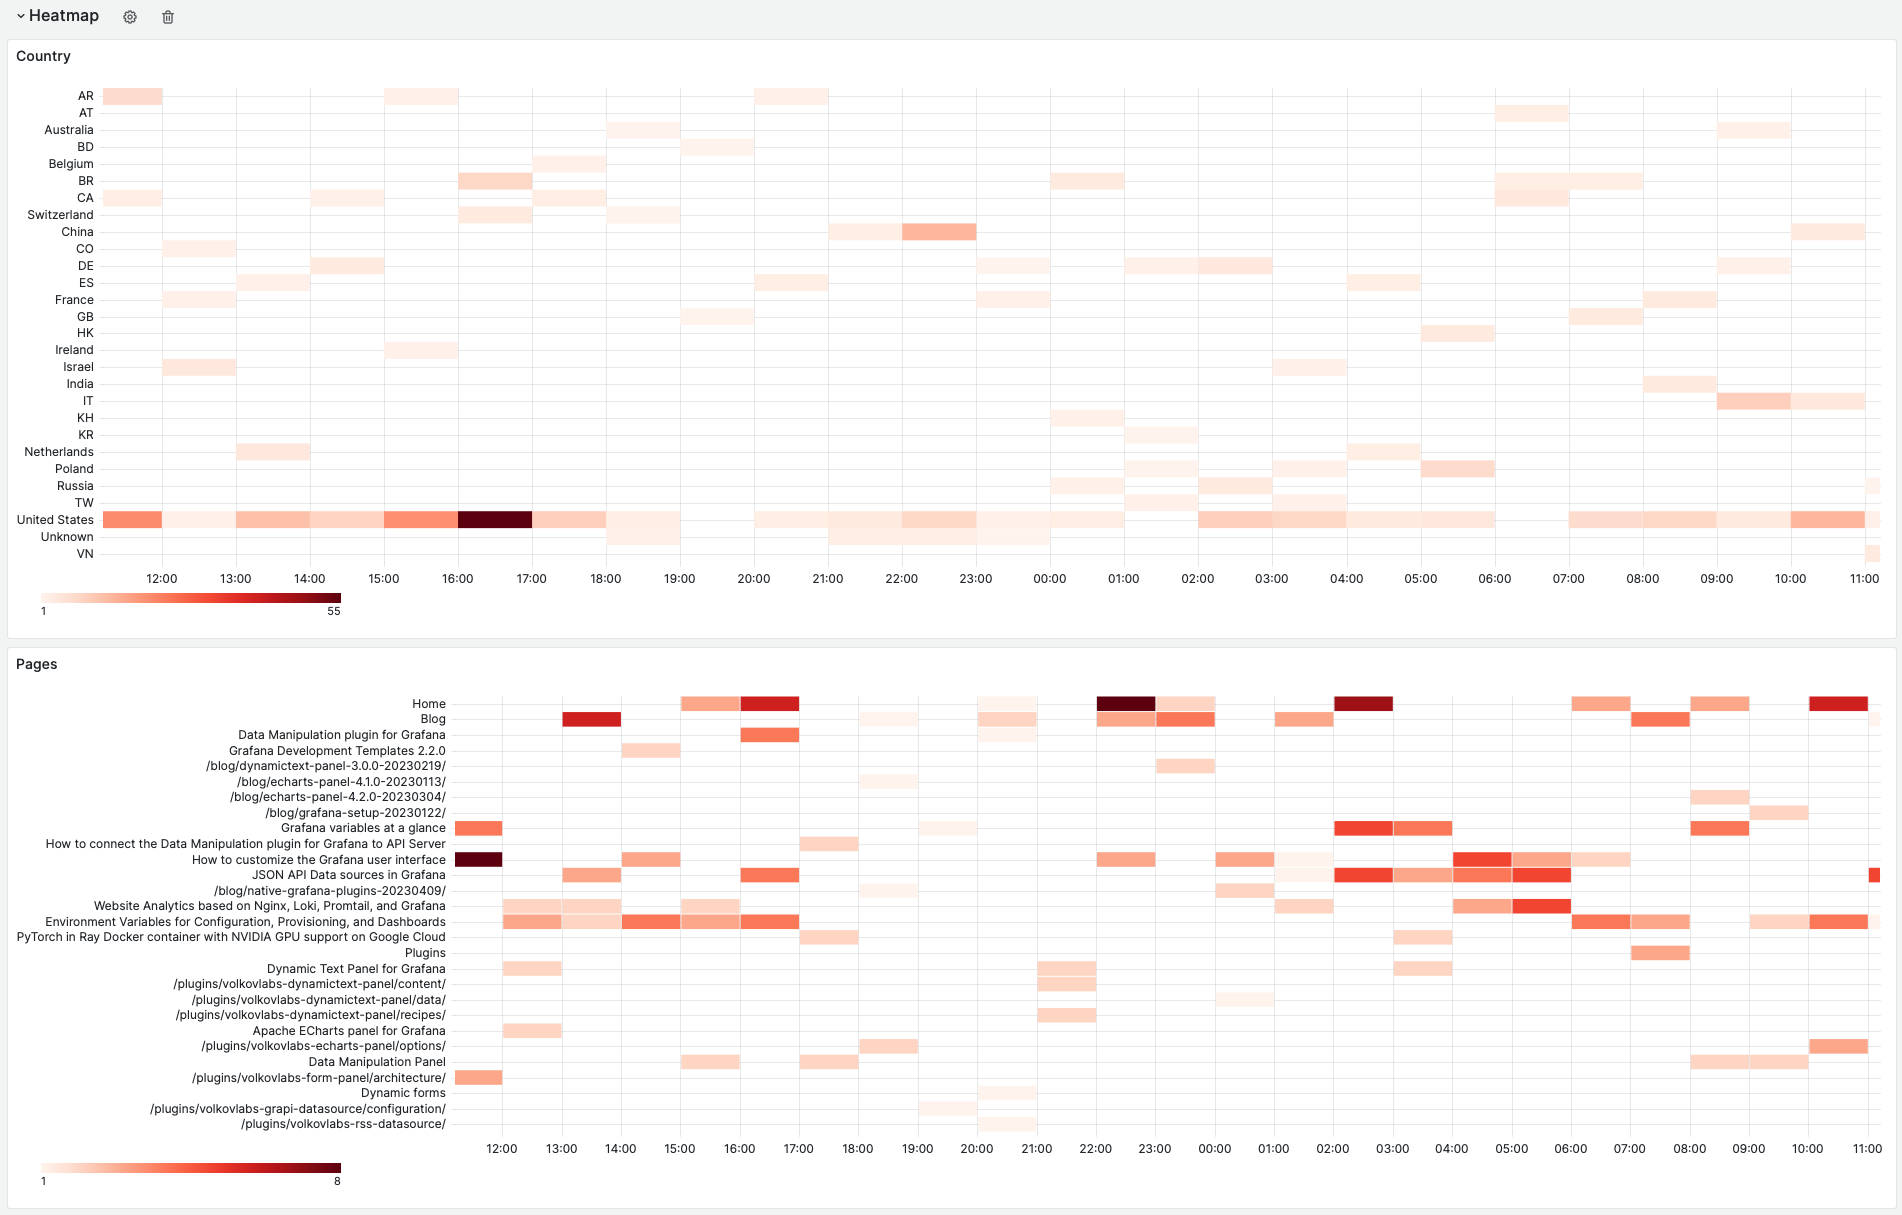
Heatmap
The third part of the dashboard contains heatmaps, which help to understand when and from where resources were requested in the selected Time Range.
- Country displays requests per country.
- Requested pages display requests per resource.
Import
To import the created dashboard, find the Import menu. The location might differ depending on your installed Grafana version, but that menu should always be somewhere.
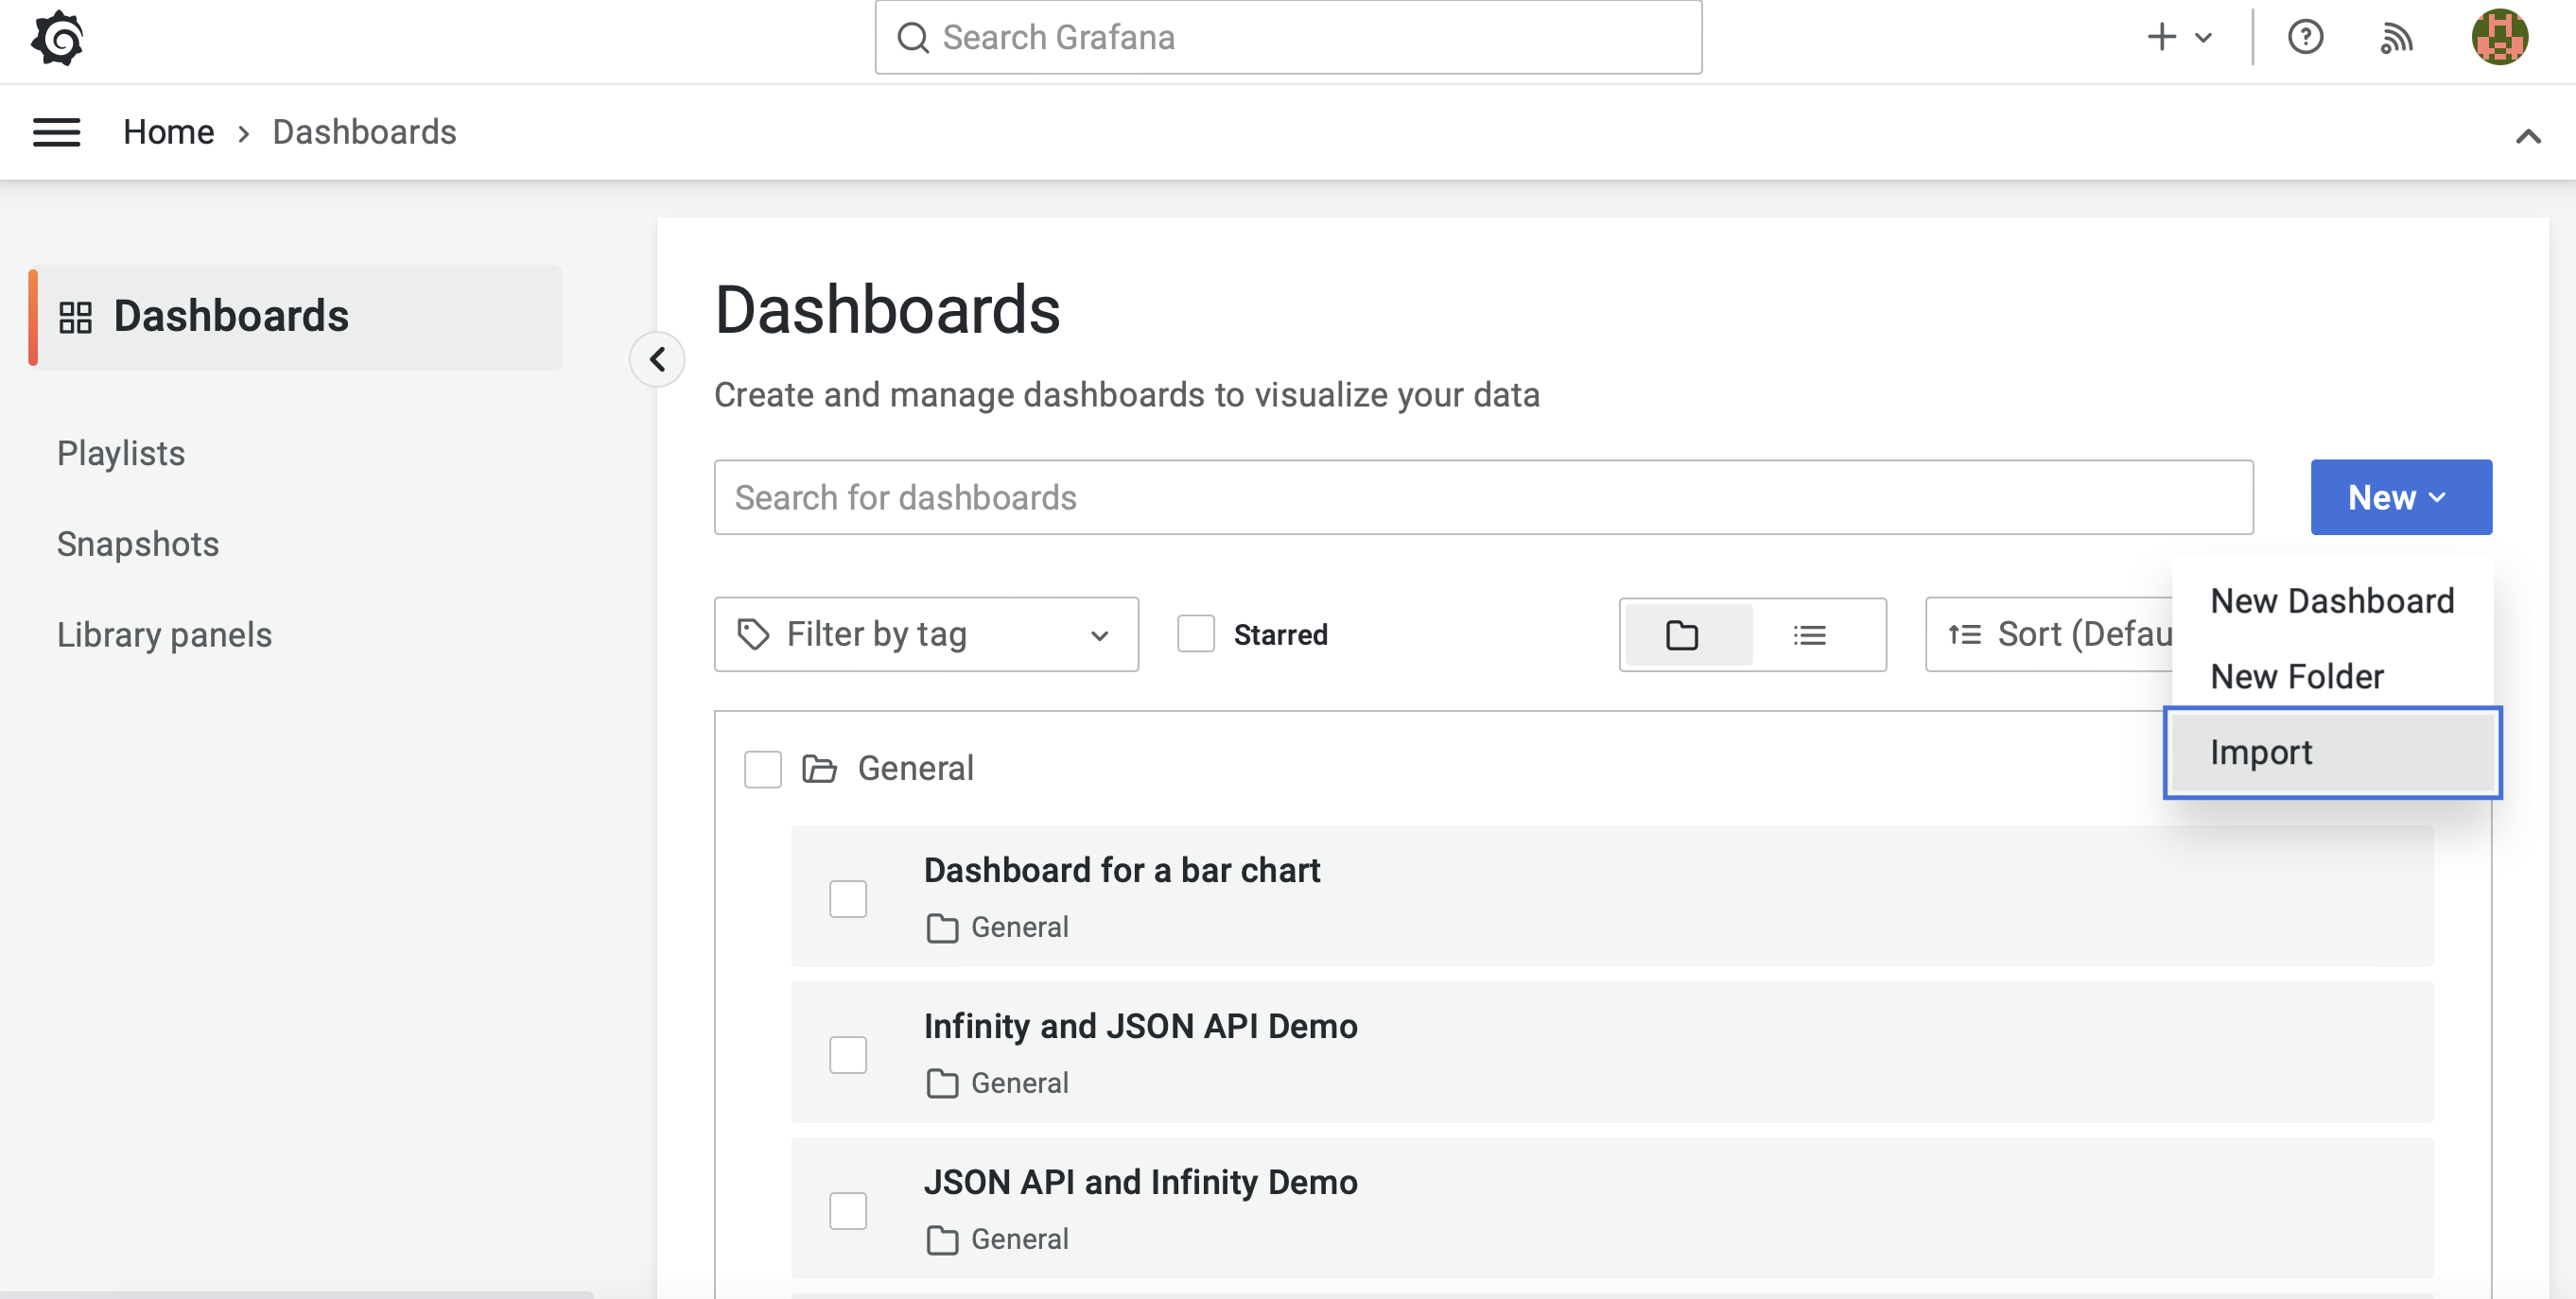
For the dashboard to function correctly, you must have the Loki data source installed and configured.
Grafana dashboard source code
loading...
Business Charts
We started with the default GeoMap panel to display requests per country. It worked as expected, plotting markers on the map with city-level precision. I prefer the country look from Google Analytics.
Country Heatmap is not supported in the GeoMap, and we used the Business Charts panel instead. In the following video, we demonstrated how we did it.
Summary
The proposed solution beat our expectations, and we are looking forward to updating the Grafana dashboard based on the collected data in the upcoming weeks.
Eliminating unnecessary data allows us to laser focus on the metrics we are looking for. The created dashboard is clean without unnecessary clutter — an excellent example of pure elegance.