Variables
Supporting dashboard variables greatly simplifies work with configuring the alerting in general.
Let's say, you have two very similar devices and your task is to monitor their technical health by creating alerts in the event of an alert rule breach.
Your alert rules are almost identical for both devices with only thresholds being slightly different. For instance, the CPU usage of one device must stay within the 0 to 2 percent range and the other CPU usage can go over 2%.
Without dashboard variables, you have to create two separate alert rules. For a small number of devices, this approach is reasonable. However, it turns into a severe headache once instead of two devices you need to maintain hundreds. For every device, you will have to create and maintain a separate alert rule containing an identical query.
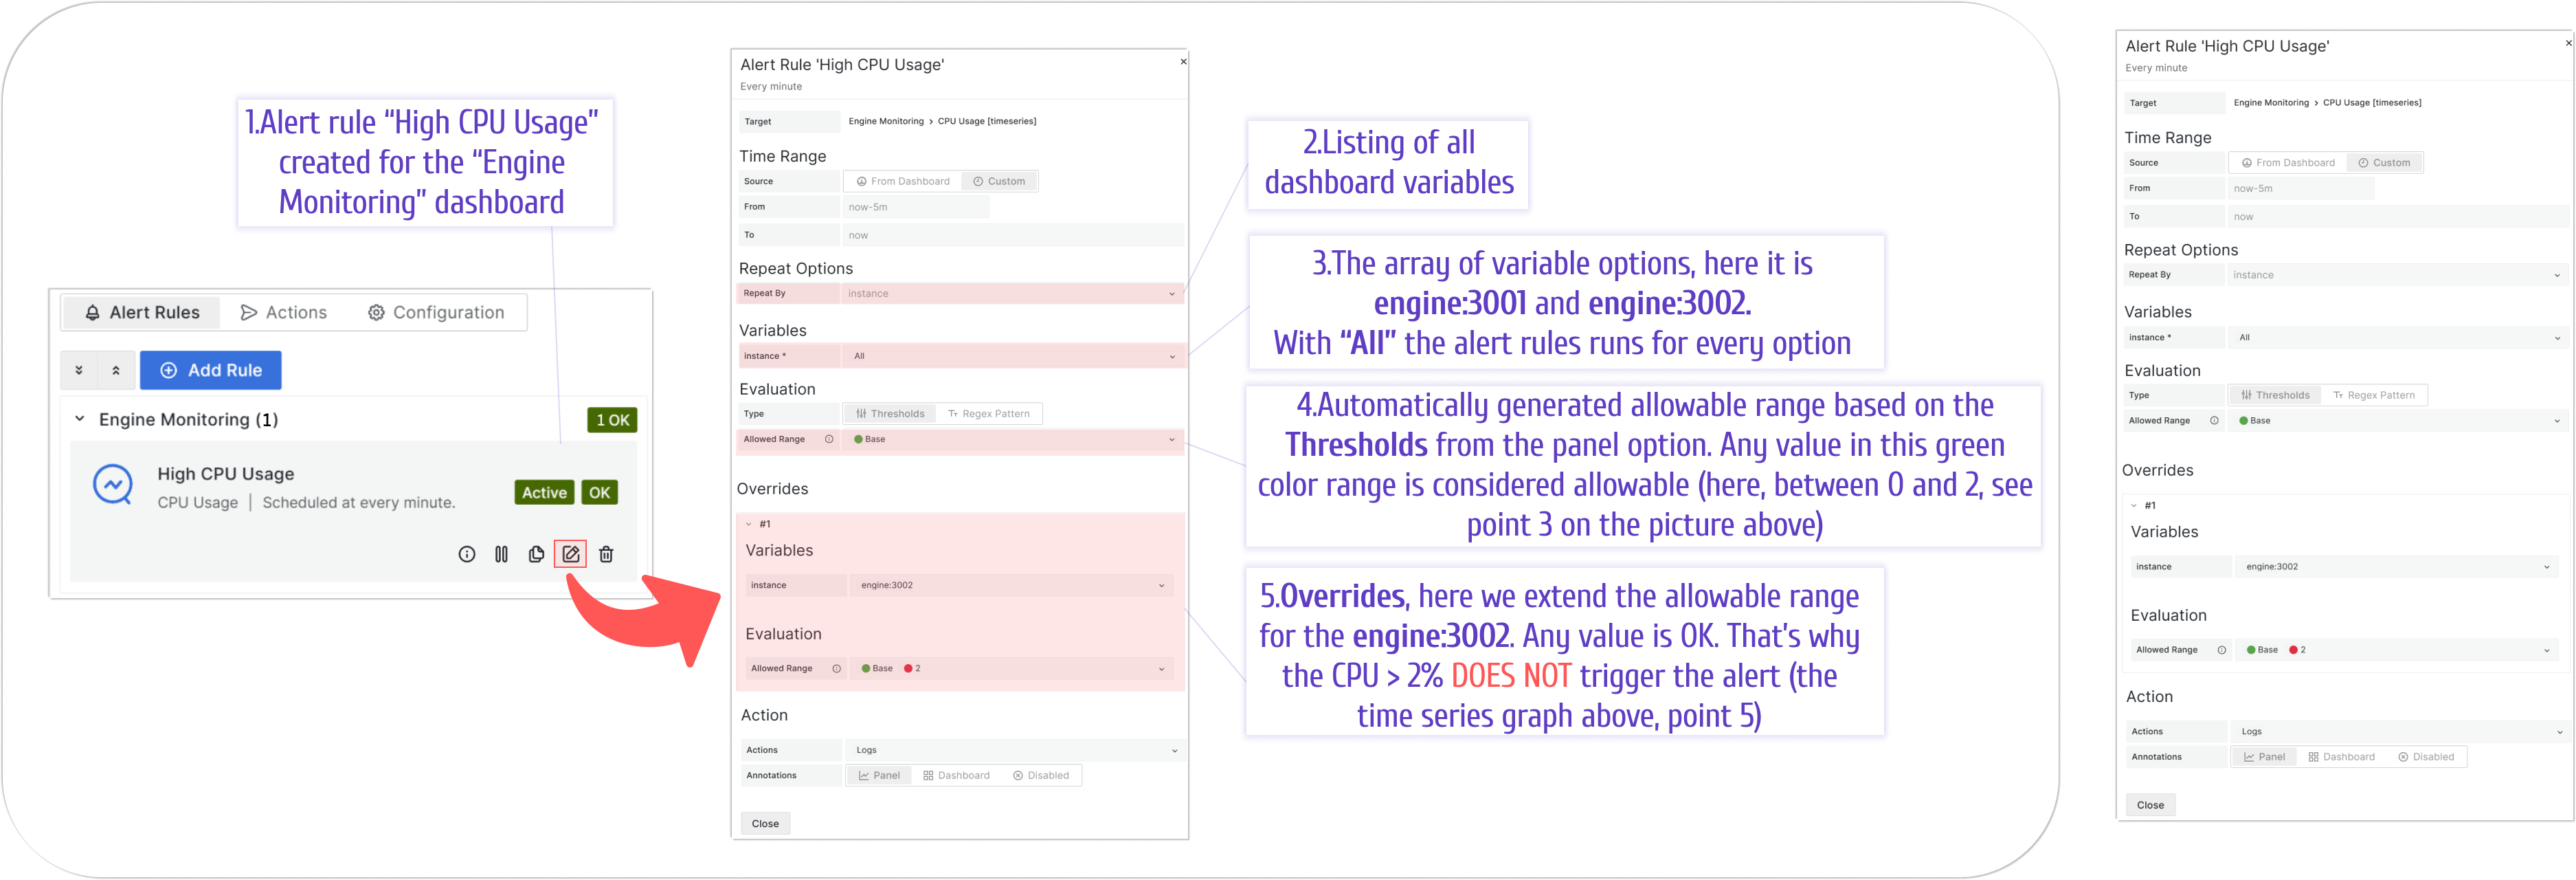
With dashboard variables enabled, creating one alert rule is enough. The thresholds could be configured in the Overrides.
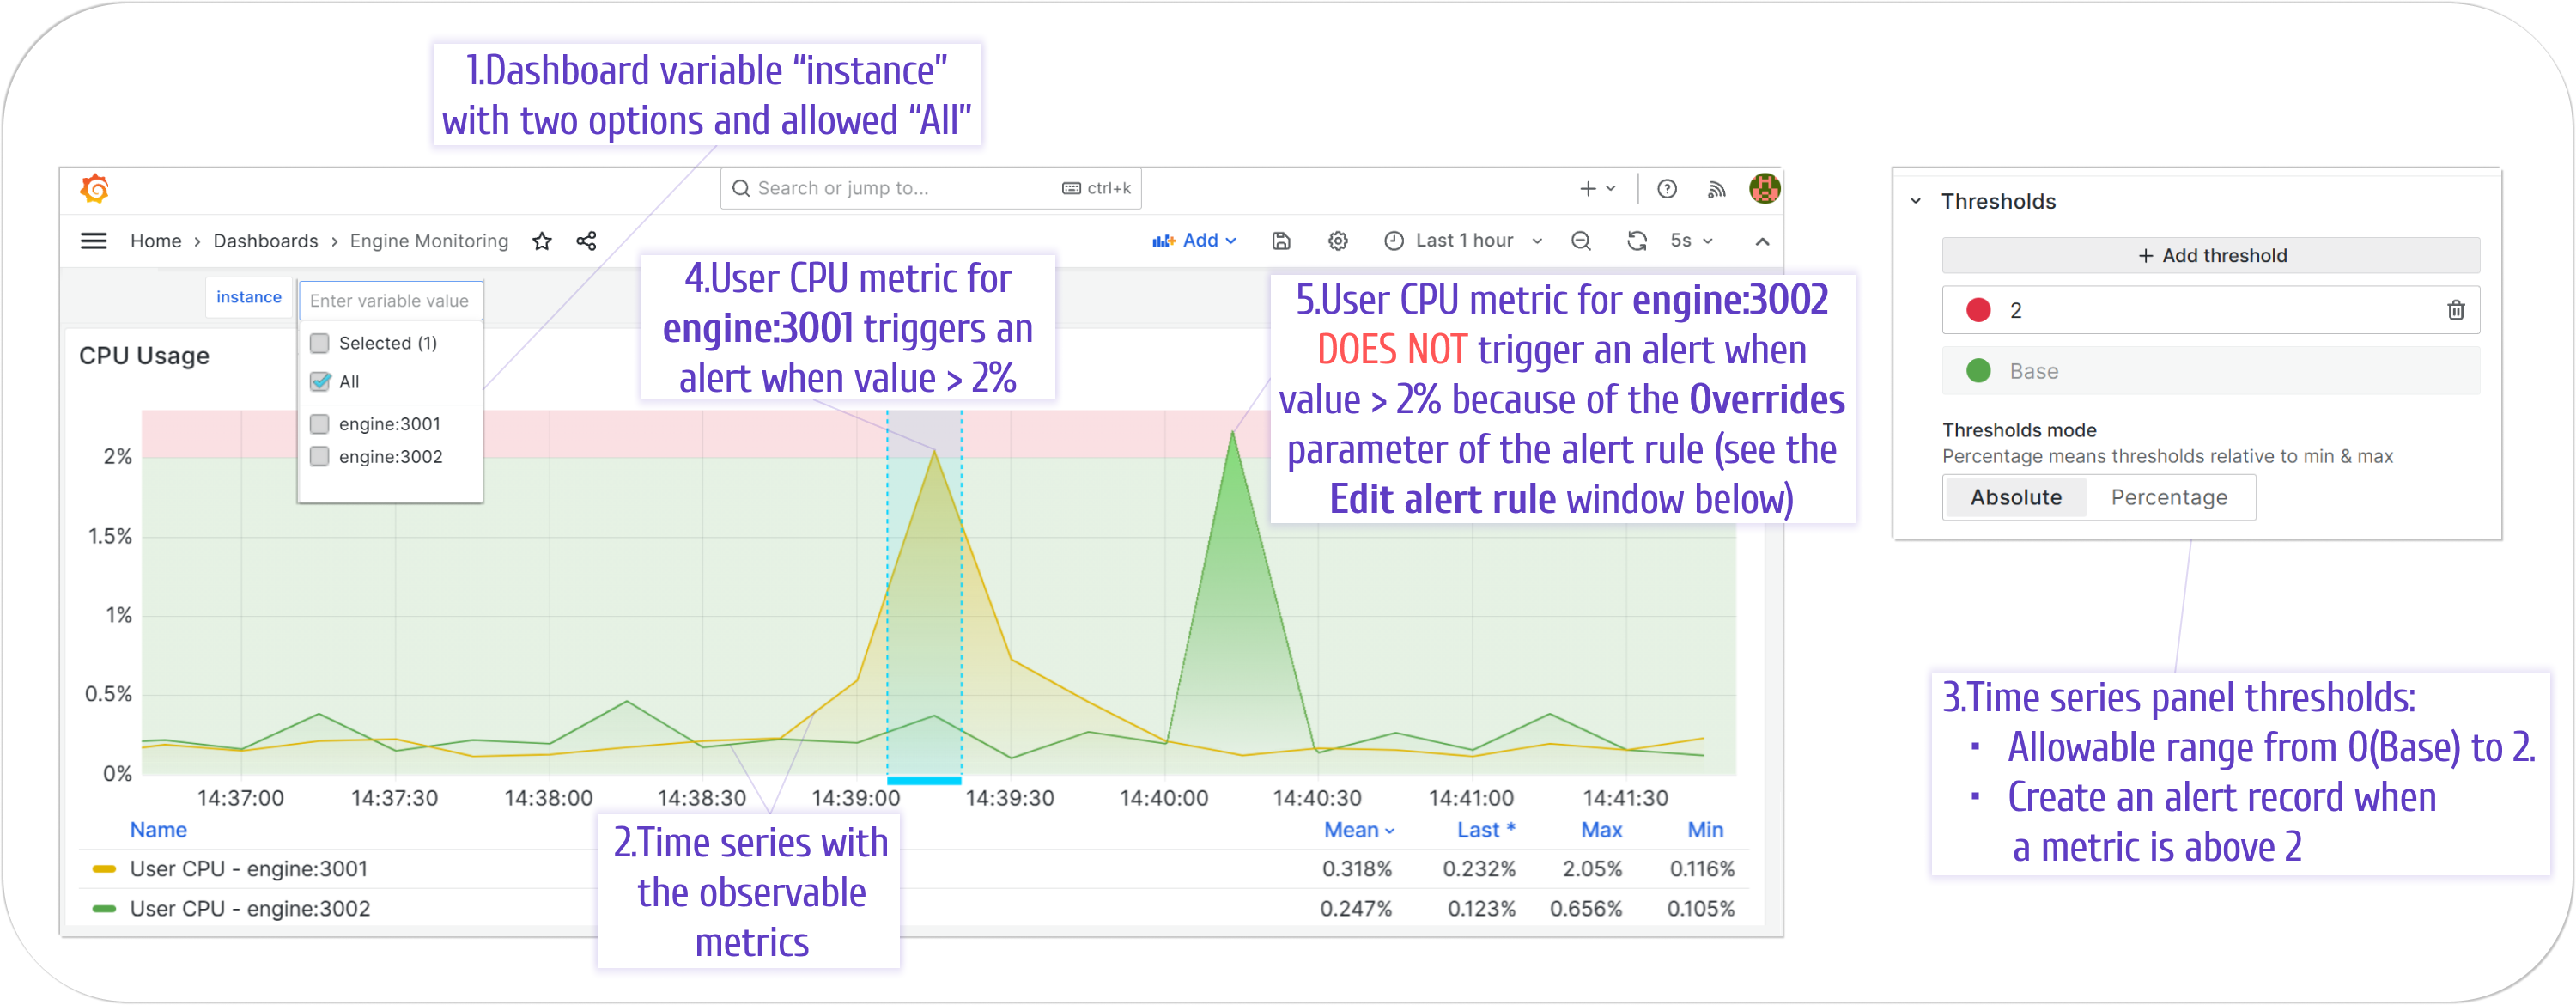
Here is an example of the Time Series visualization where one data series triggers an alert and another does not.
Below is what the configuration of the alert rule using dashboard variables looks like.