This blog post was initiated by our GitHub sponsor and community questions. While working on a detailed answer, we realized that the solution to this question covers multiple hot Grafana topics and might thus be of interest to many Community members.
Collaboration with the Community, if used wisely, can produce great results. Many times it inspired us to take an unexpected but very anticipated turn on the product roadmap. Collecting ideas and struggles worldwide is a clever way to move forward by creating the most coveted products.
We are aware that our readers come from a wide range of backgrounds. To better convey today's topic, we constructed a tiny project for which we describe two states—current and enhanced. Following this article, you can learn how to go from one to another, or in other words, you can start with a current-state dashboard and then enhance it with all the required features.
We are open to questions; please leave them as comments on our YouTube channel.
Current state
We will start by describing the project in its current state.
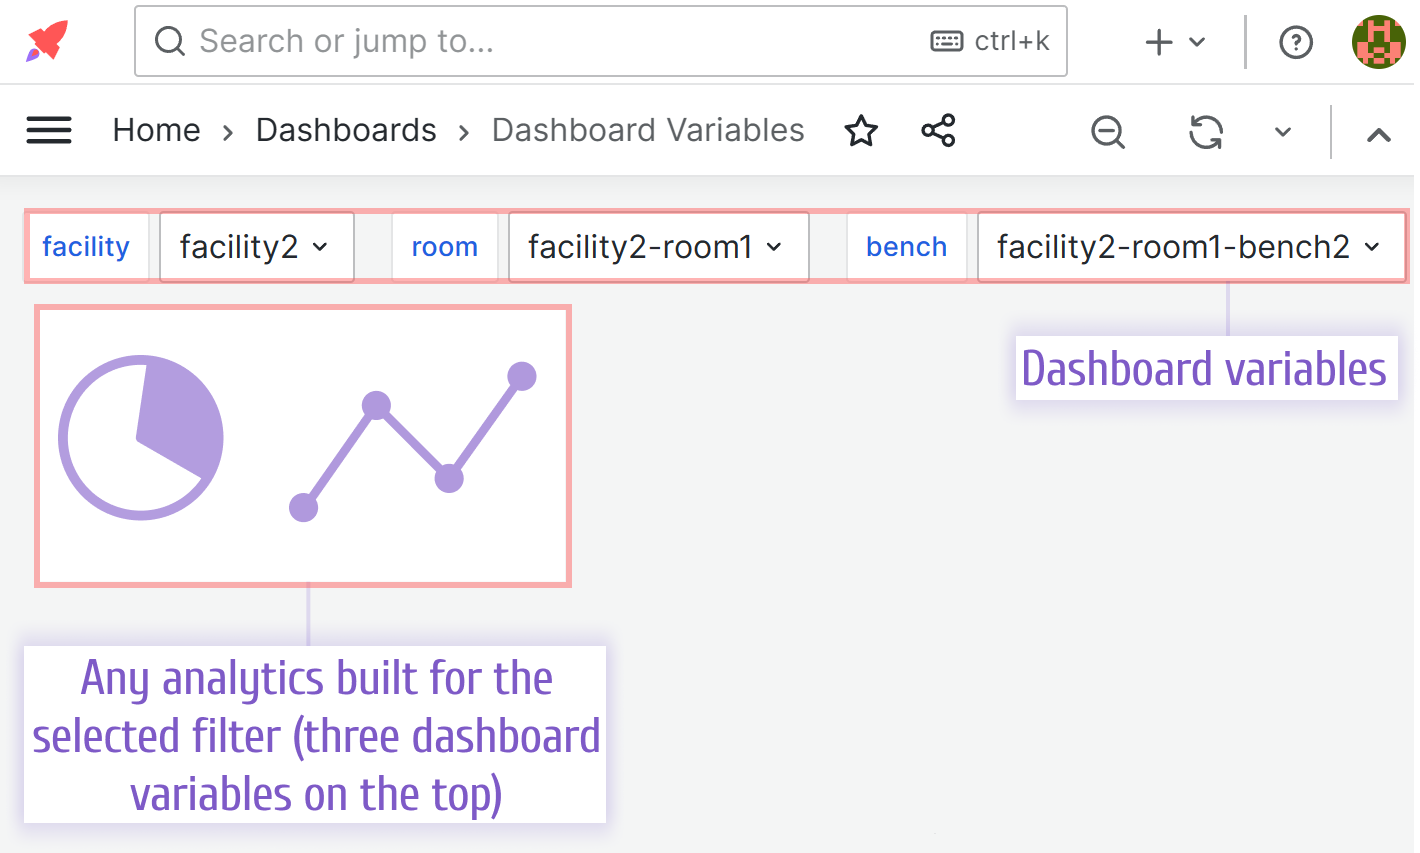
- A Grafana dashboard with three hierarchical dashboard variables.
- Any panel that rerenders according to the selected dashboard variable combination.
Dashboard variables
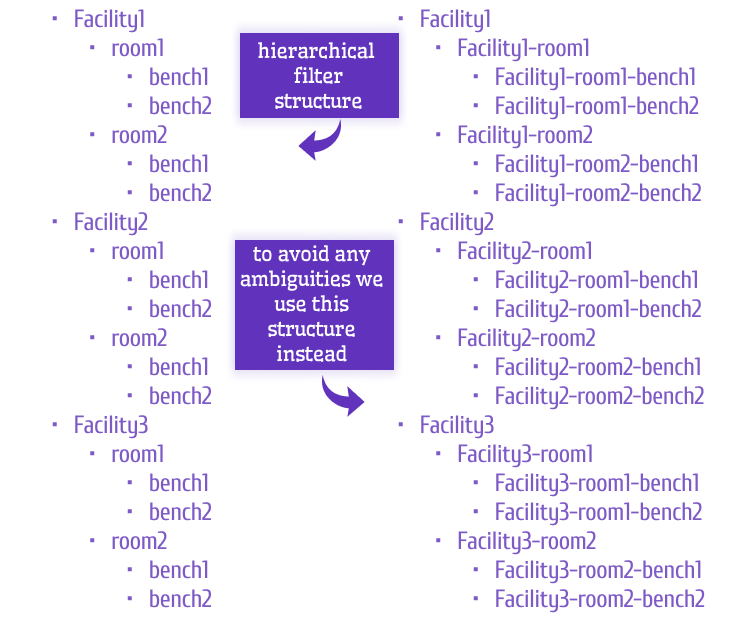
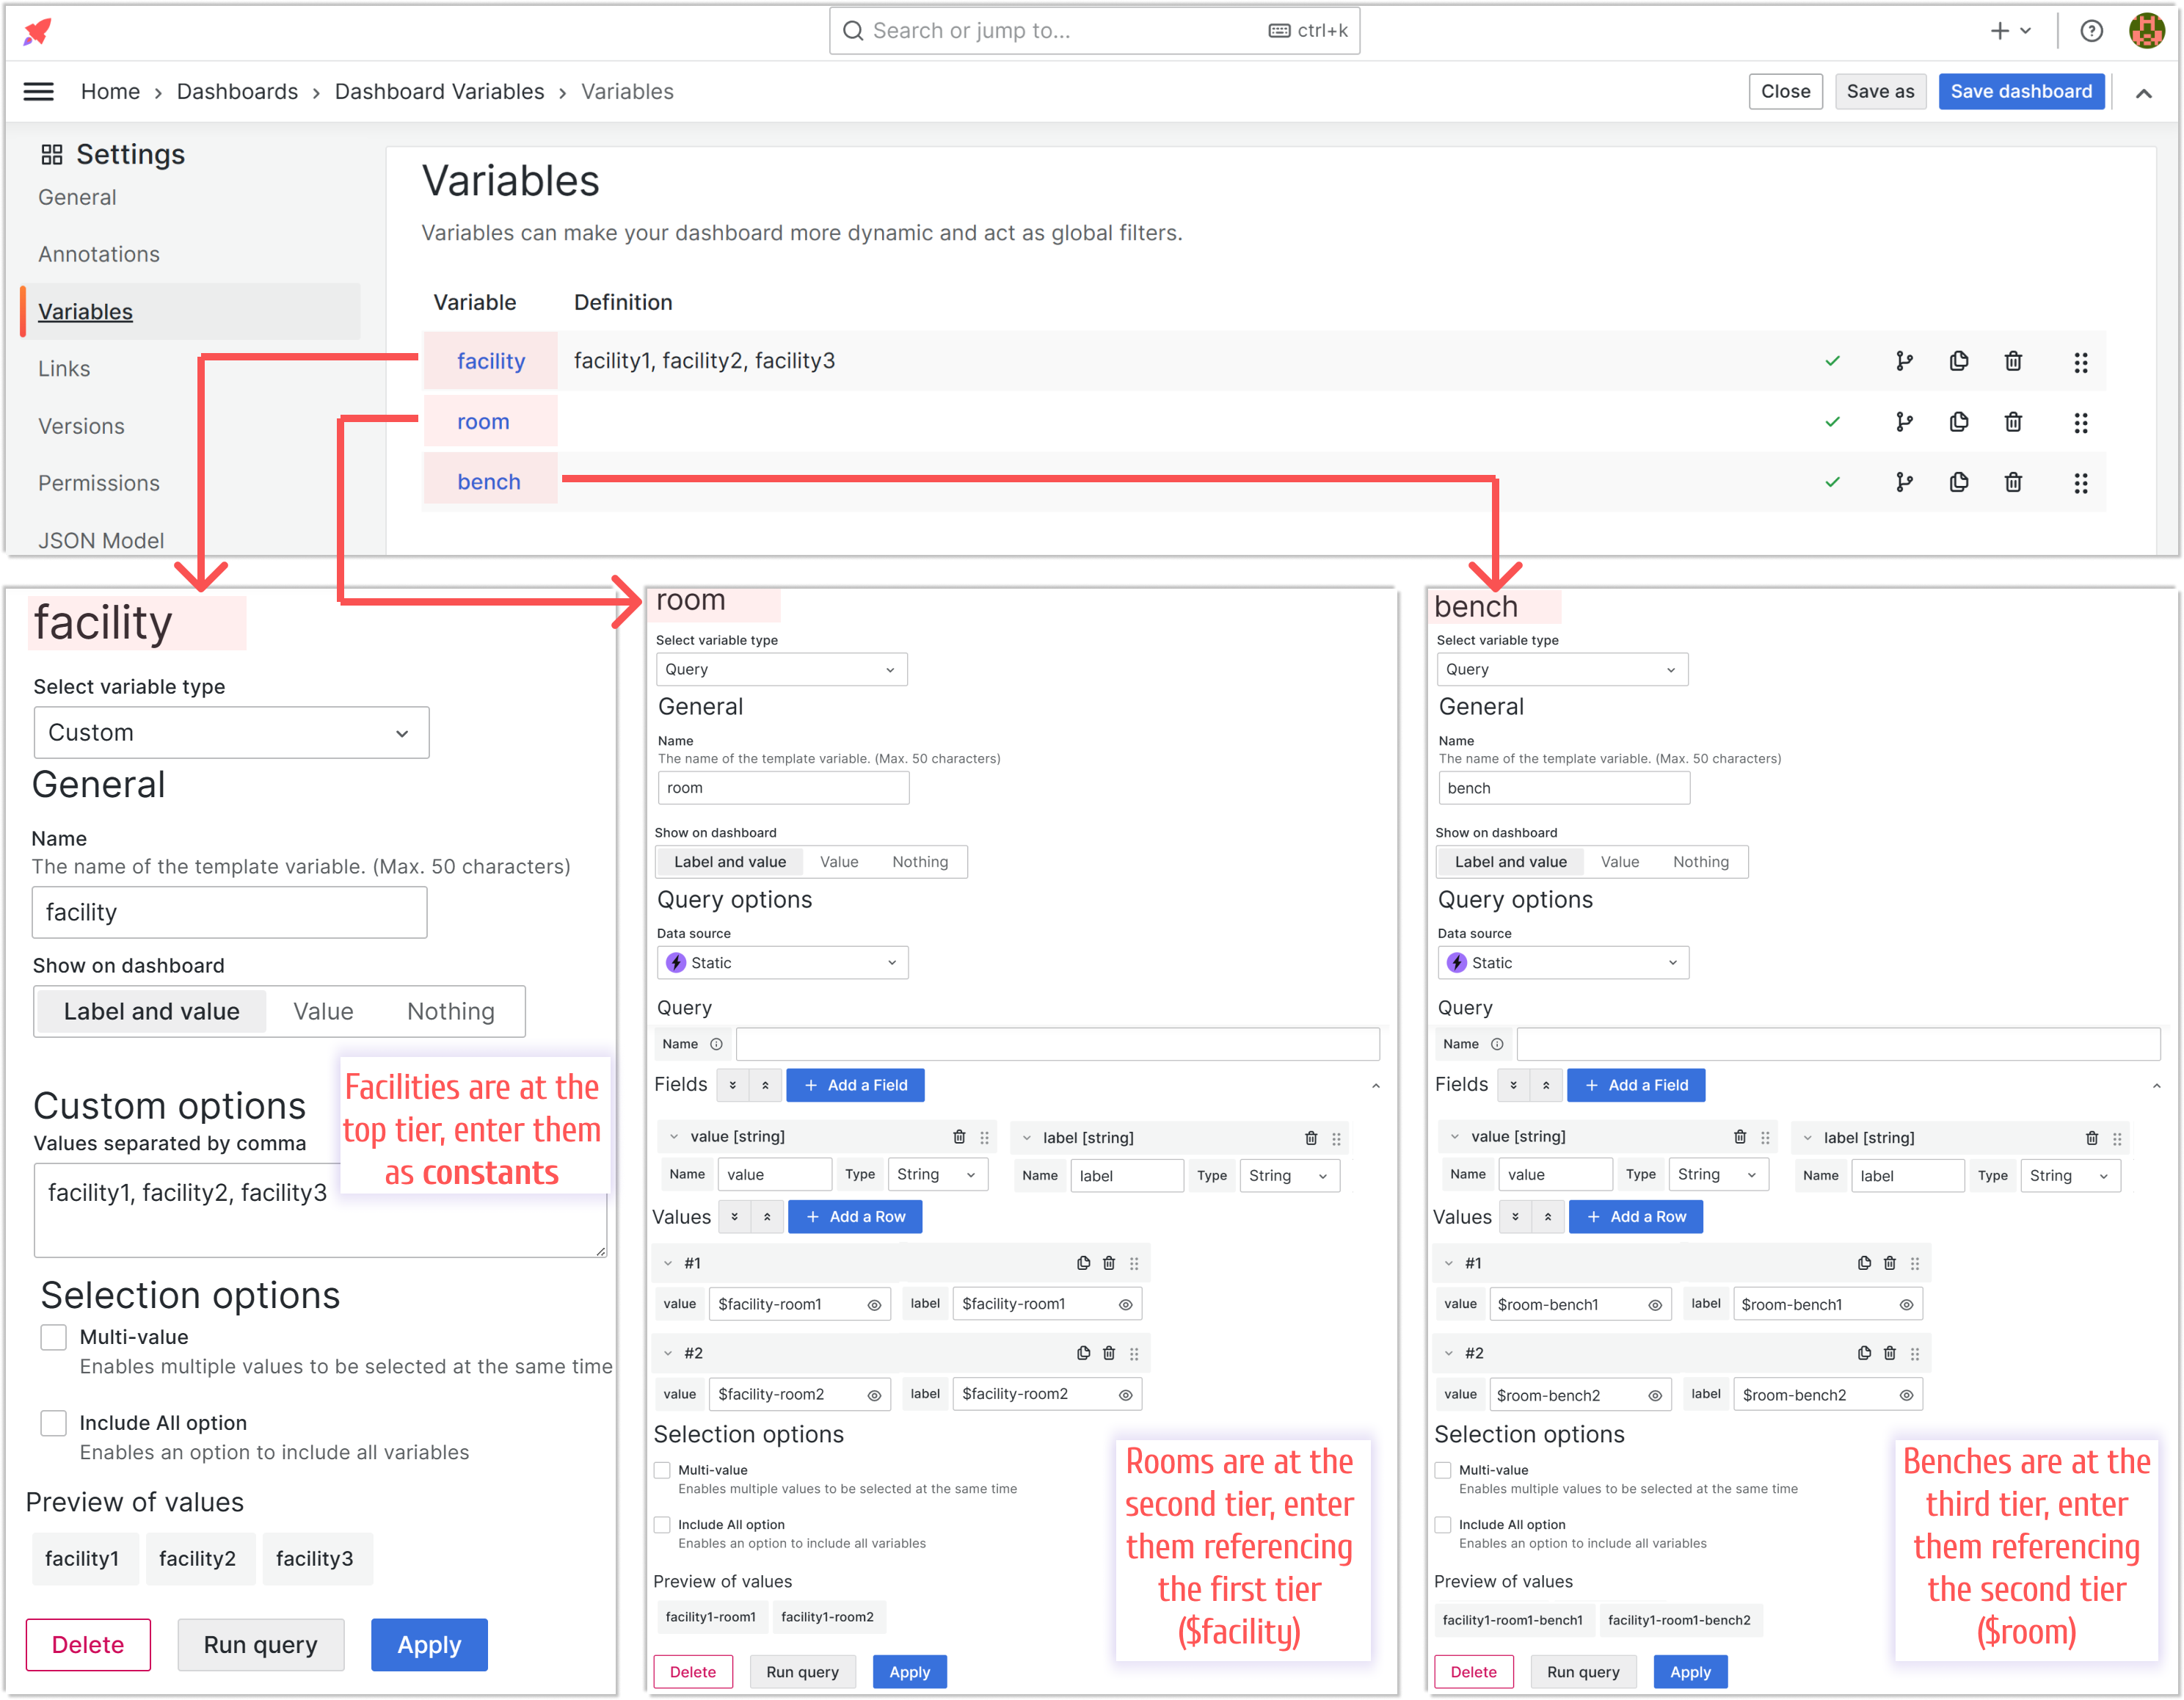
The dashboard variables have a hierarchical structure. From the Grafana perspective, this means that the second variable is limited by the first and the third is limited by the second.
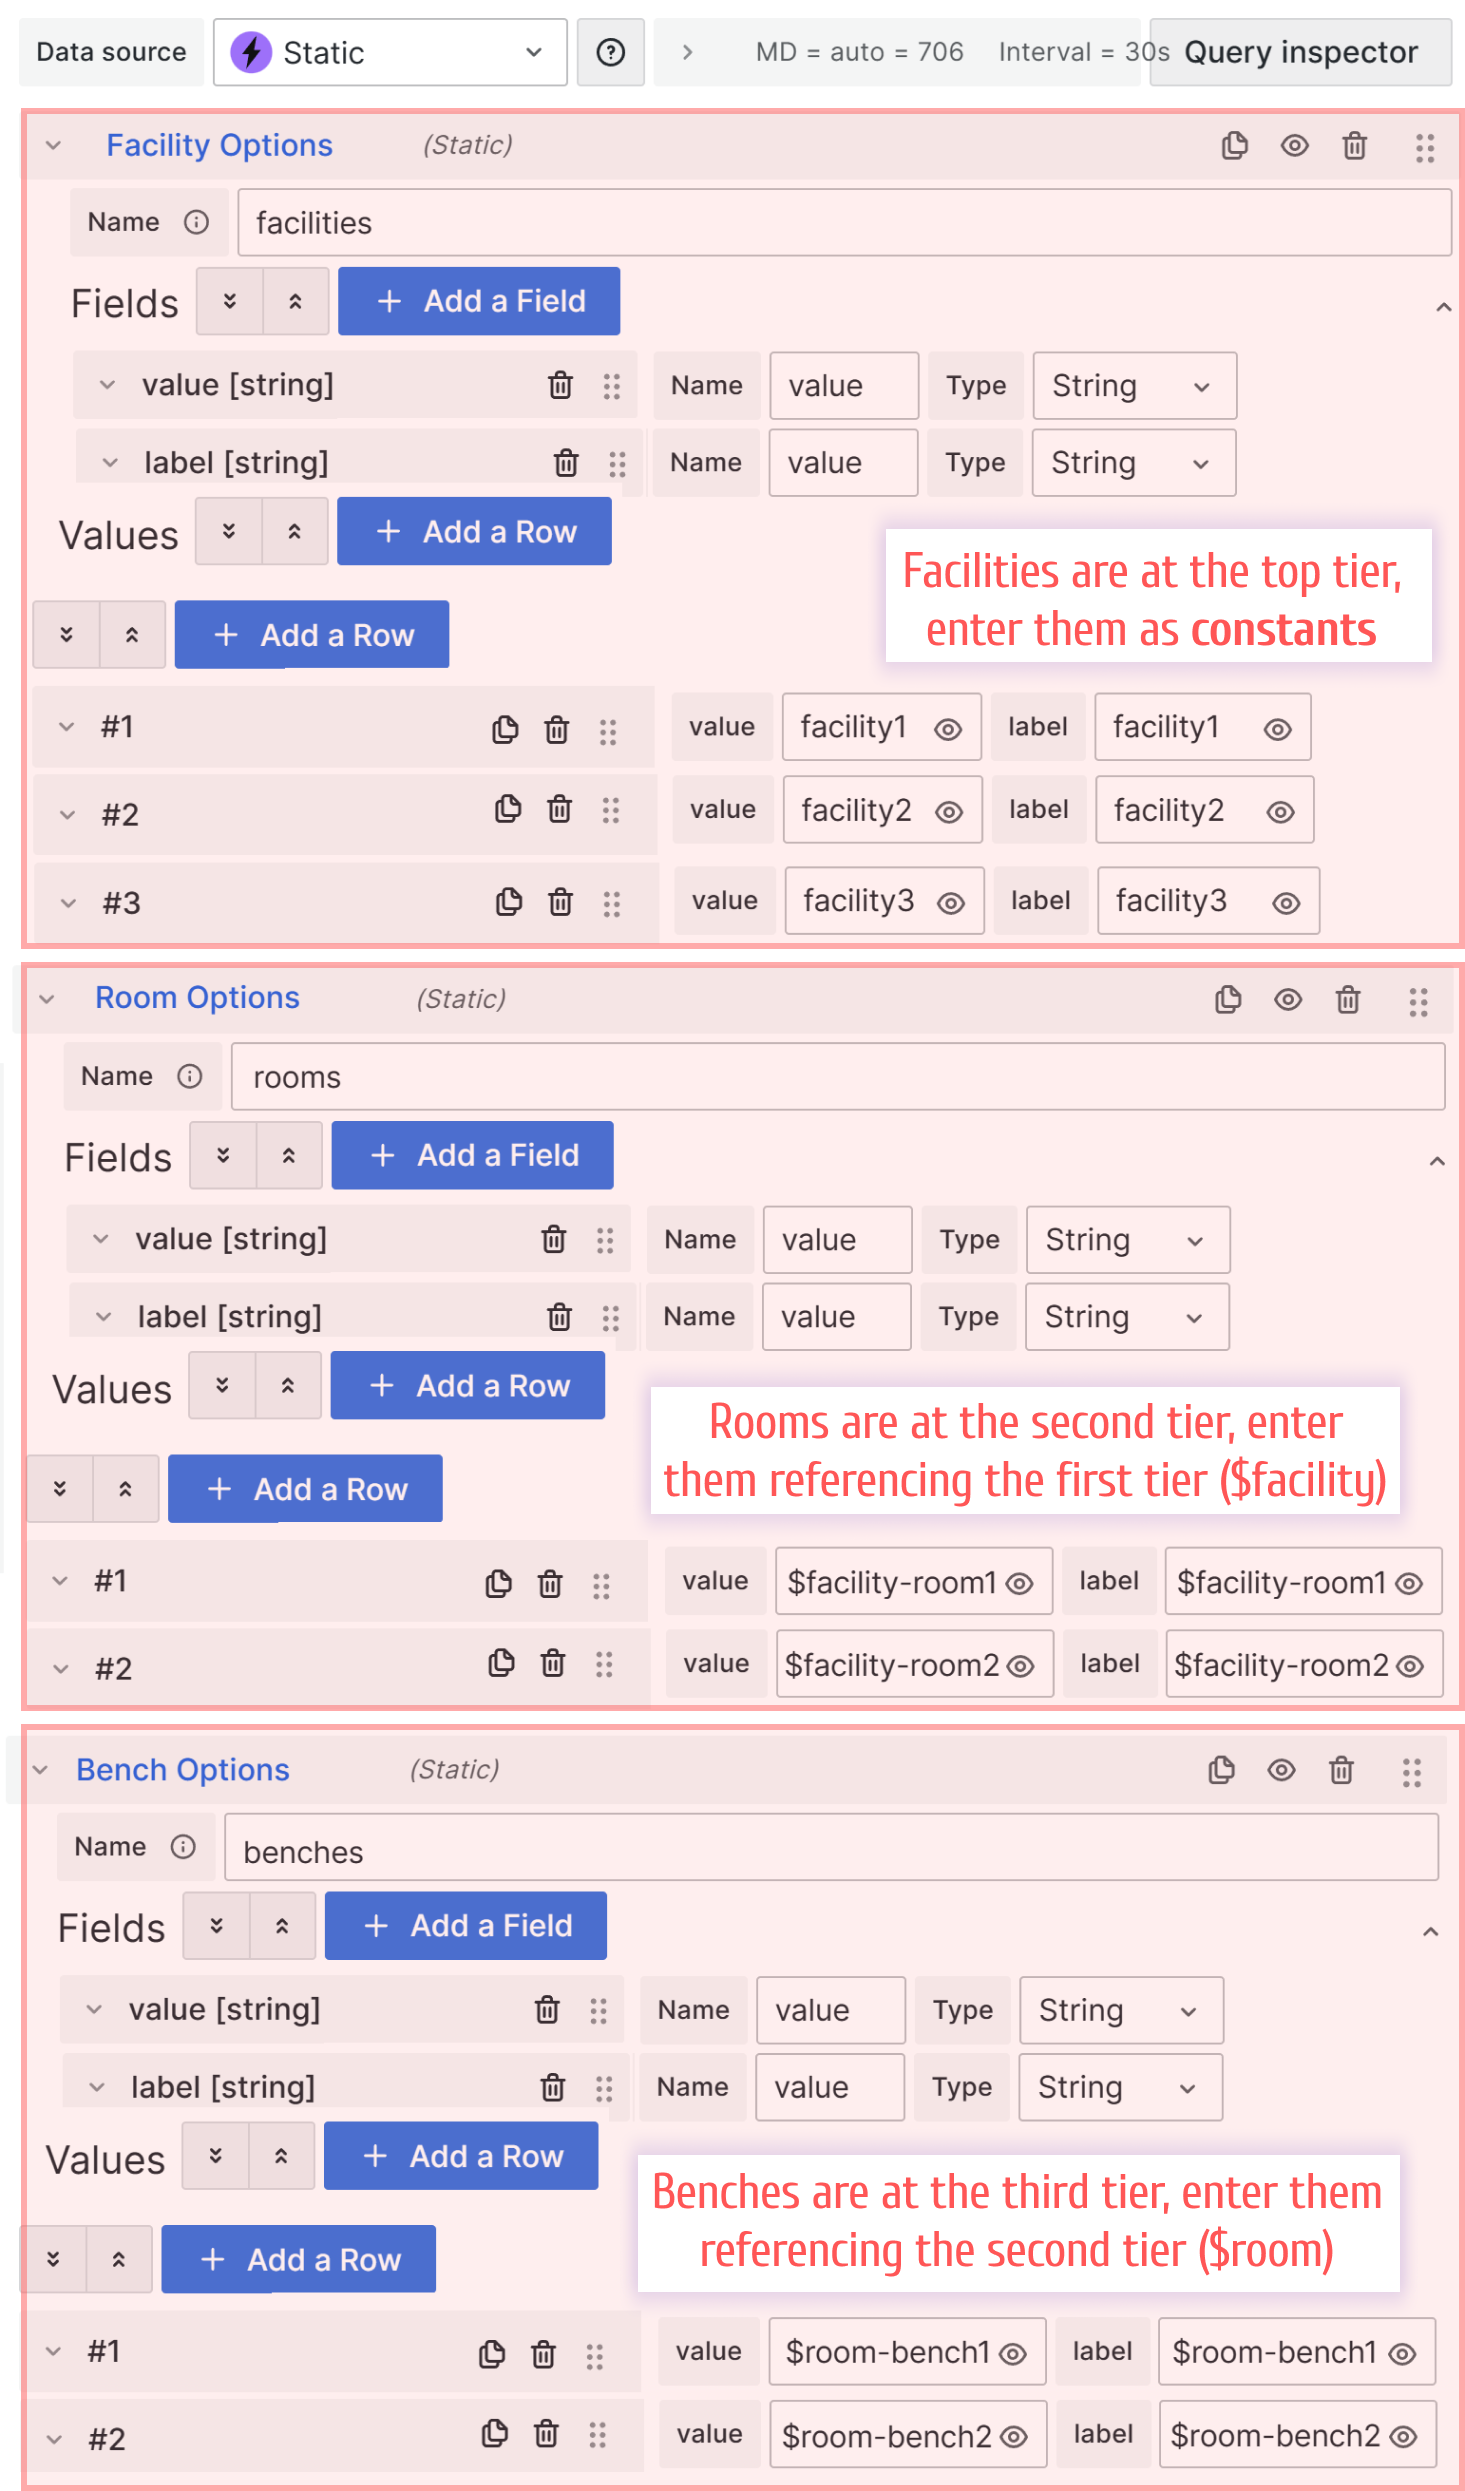
Here is what the configuration of the dashboard variables looks like. We usually use the Static Data Source in our demo projects. We do it for many reasons, including making it straightforward to follow our steps.
For reference below are the dashboard variables described in the JSON format:
[
  {
    "current": {
      "selected": false,
      "text": "facility3",
      "value": "facility3"
    },
    "hide": 0,
    "includeAll": false,
    "multi": false,
    "name": "facility",
    "options": [
      {
        "selected": false,
        "text": "facility1",
        "value": "facility1"
      },
      {
        "selected": false,
        "text": "facility2",
        "value": "facility2"
      },
      {
        "selected": true,
        "text": "facility3",
        "value": "facility3"
      }
    ],
    "query": "facility1, facility2, facility3",
    "queryValue": "",
    "skipUrlSync": false,
    "type": "custom"
  },
  {
    "current": {
      "selected": false,
      "text": "facility3-room1",
      "value": "facility3-room1"
    },
    "datasource": {
      "type": "marcusolsson-static-datasource",
      "uid": "P1D2C73DC01F2359B"
    },
    "definition": "",
    "hide": 0,
    "includeAll": false,
    "multi": false,
    "name": "room",
    "options": [],
    "query": {
      "frame": {
        "fields": [
          {
            "config": {},
            "name": "value",
            "type": "string",
            "values": ["$facility-room1", "$facility-room2"]
          },
          {
            "config": {},
            "name": "label",
            "type": "string",
            "values": ["$facility-room1", "$facility-room2"]
          }
        ],
        "meta": {}
      }
    },
    "refresh": 1,
    "regex": "",
    "skipUrlSync": false,
    "sort": 0,
    "type": "query"
  },
  {
    "current": {
      "selected": false,
      "text": "facility3-room1-bench2",
      "value": "facility3-room1-bench2"
    },
    "datasource": {
      "type": "marcusolsson-static-datasource",
      "uid": "P1D2C73DC01F2359B"
    },
    "definition": "",
    "hide": 0,
    "includeAll": false,
    "multi": false,
    "name": "bench",
    "options": [],
    "query": {
      "frame": {
        "fields": [
          {
            "config": {},
            "name": "value",
            "type": "string",
            "values": ["$room-bench1", "$room-bench2"]
          },
          {
            "config": {},
            "name": "label",
            "type": "string",
            "values": ["$room-bench1", "$room-bench2"]
          }
        ],
        "meta": {}
      }
    },
    "refresh": 1,
    "regex": "",
    "skipUrlSync": false,
    "sort": 0,
    "type": "query"
  }
]
Enhanced state
The requirements for the enhanced state are as follows:
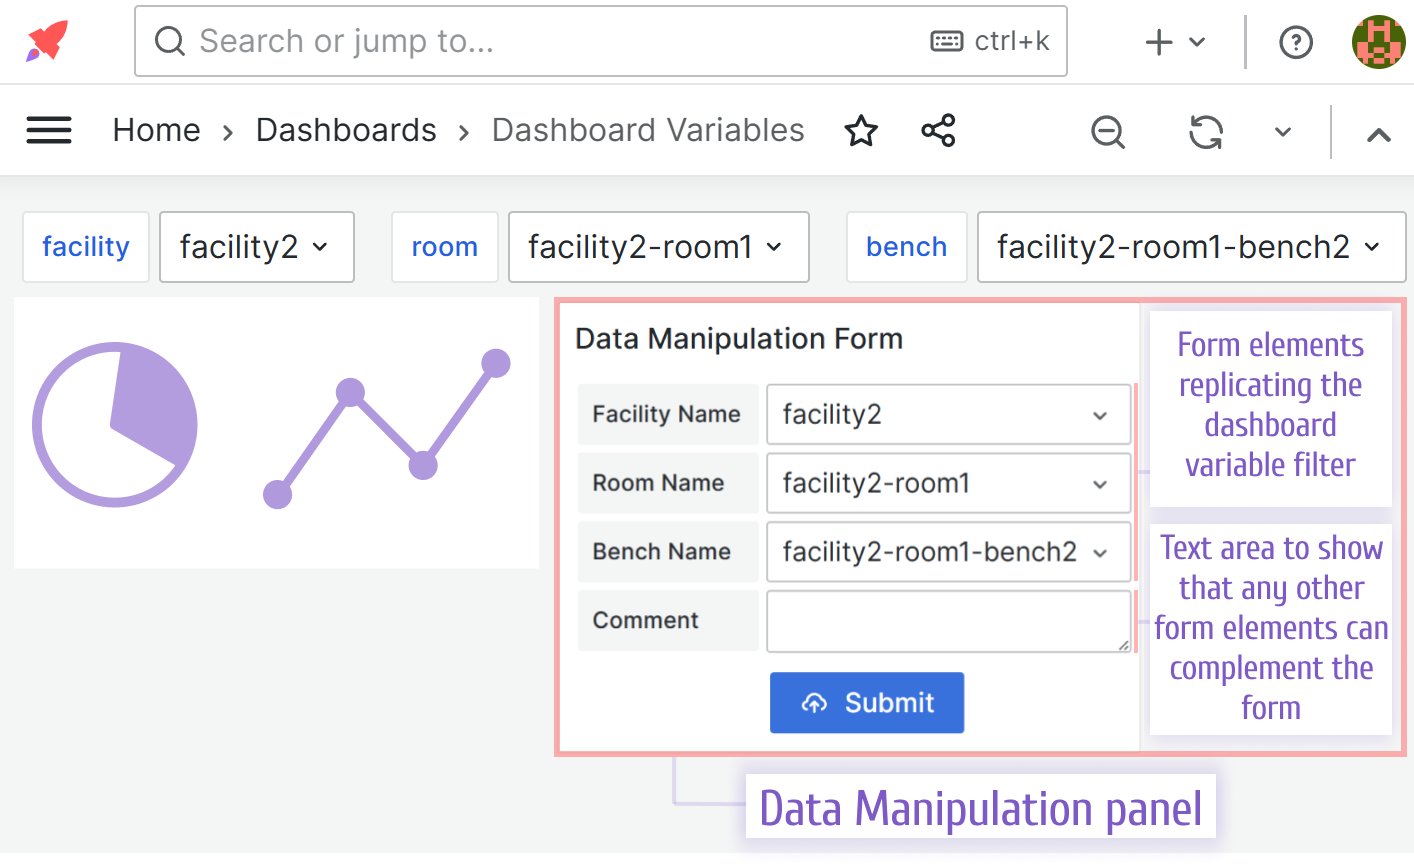
- Add the Data Manipulation panel that mirrors the functionality of the dashboard variables.
- Allows to enter observations and comments related to the selected variables.
The described solution consists of these components:
- Synchronization between dashboard variables and the Data Manipulation form elements.
- Using a new Data Manipulation feature Element Value Changed. It is a JavaScript code area that is executed in the event of any form element changing a value.
- Conditional enablement of the Submit button.
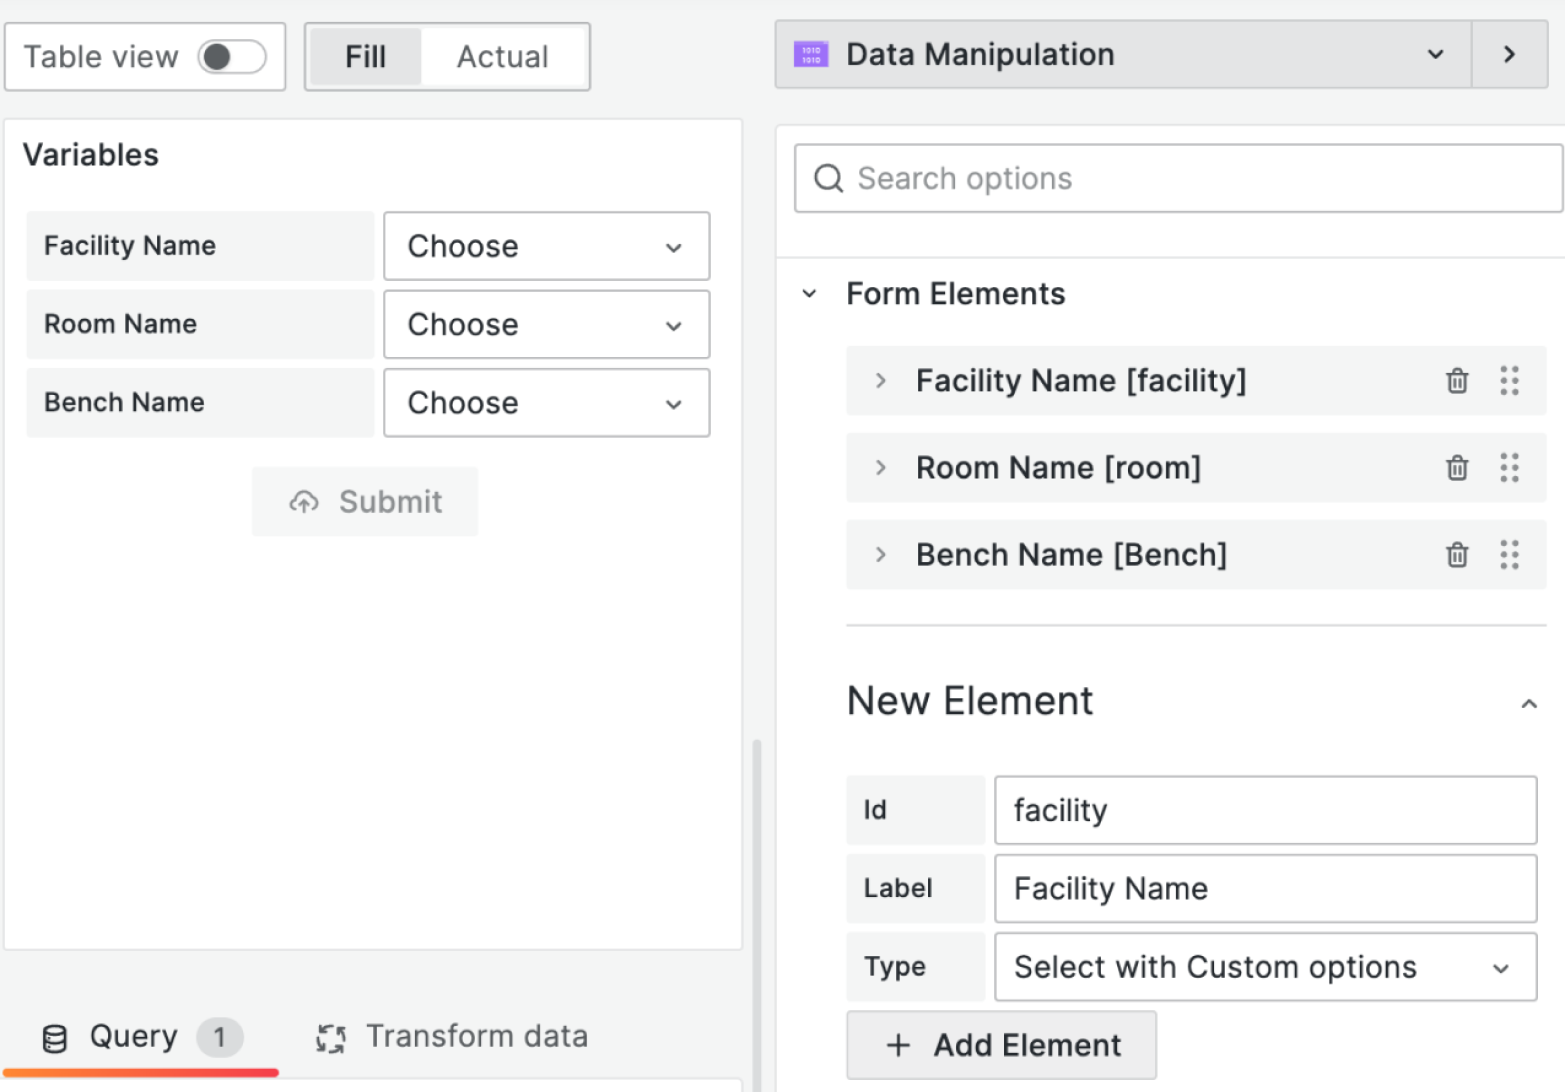
Step 1. Add the Data Manipulation panel
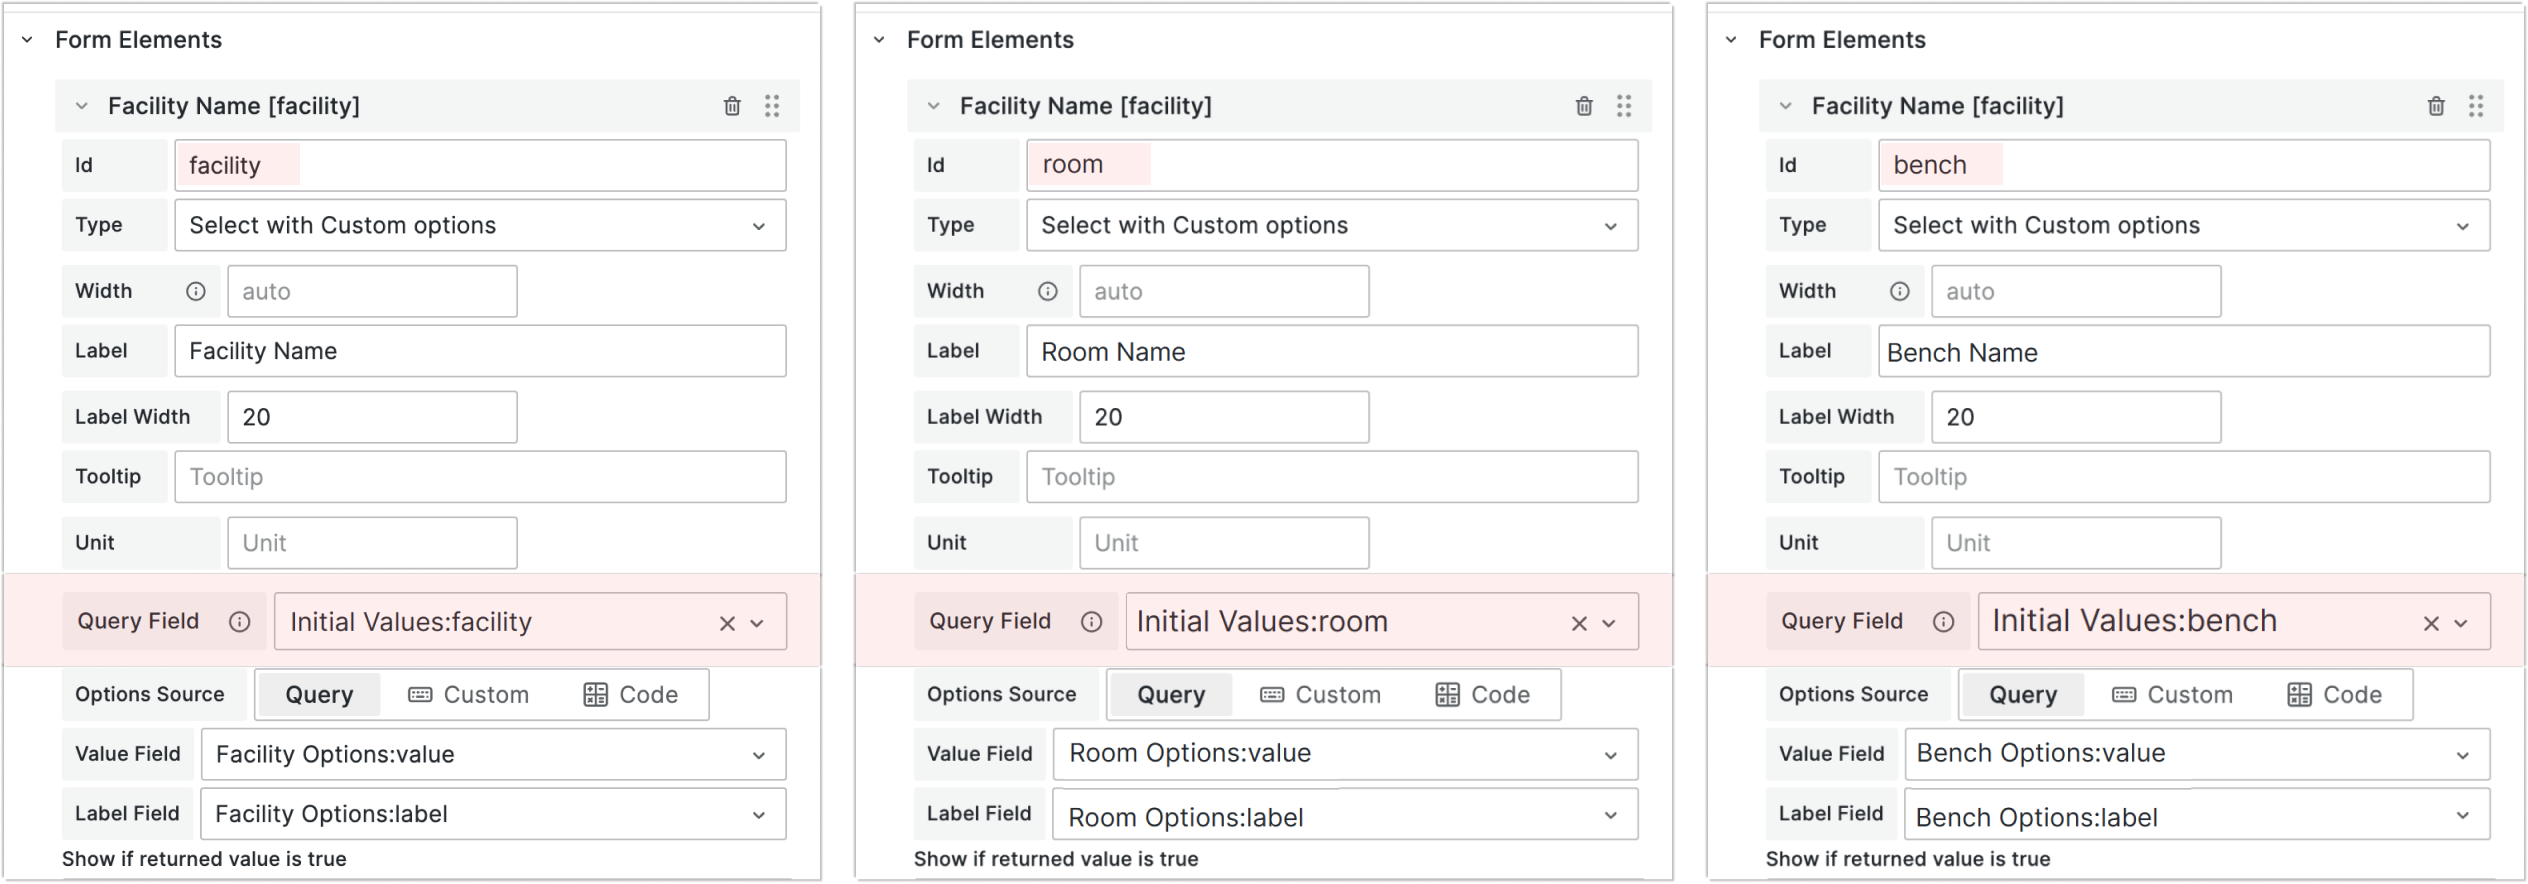
Add the Data Manipulation panel and create three form elements with the type Select with Custom Options: facility, room, and bench.
Step 2. Configure the Data Manipulation
The selectable options for each Select with Custom Options form element should be populated dynamically and be identical to the current dashboard variables choices.
Thus, we use the same approach, namely the Static Data Source. As shown below, we create three queries: Facility Options, Room Options, Bench Options.
All queries return two columns: value[string] and label[string]. The values for the Facility Options are hard-coded. For the Room Options and Bench options, the values are taken from the currently selected facility and room dashboard variables respectively.
Mapping
After a data frame is configured, we can map its fields with the form elements.
In the current Data Manipulation panel release, every Select with Custom Options type has three choices for the Options source: Query, Custom, and Code.
When Query is selected, you can specify which fields from the available data frames contain Value Field and Label Field.
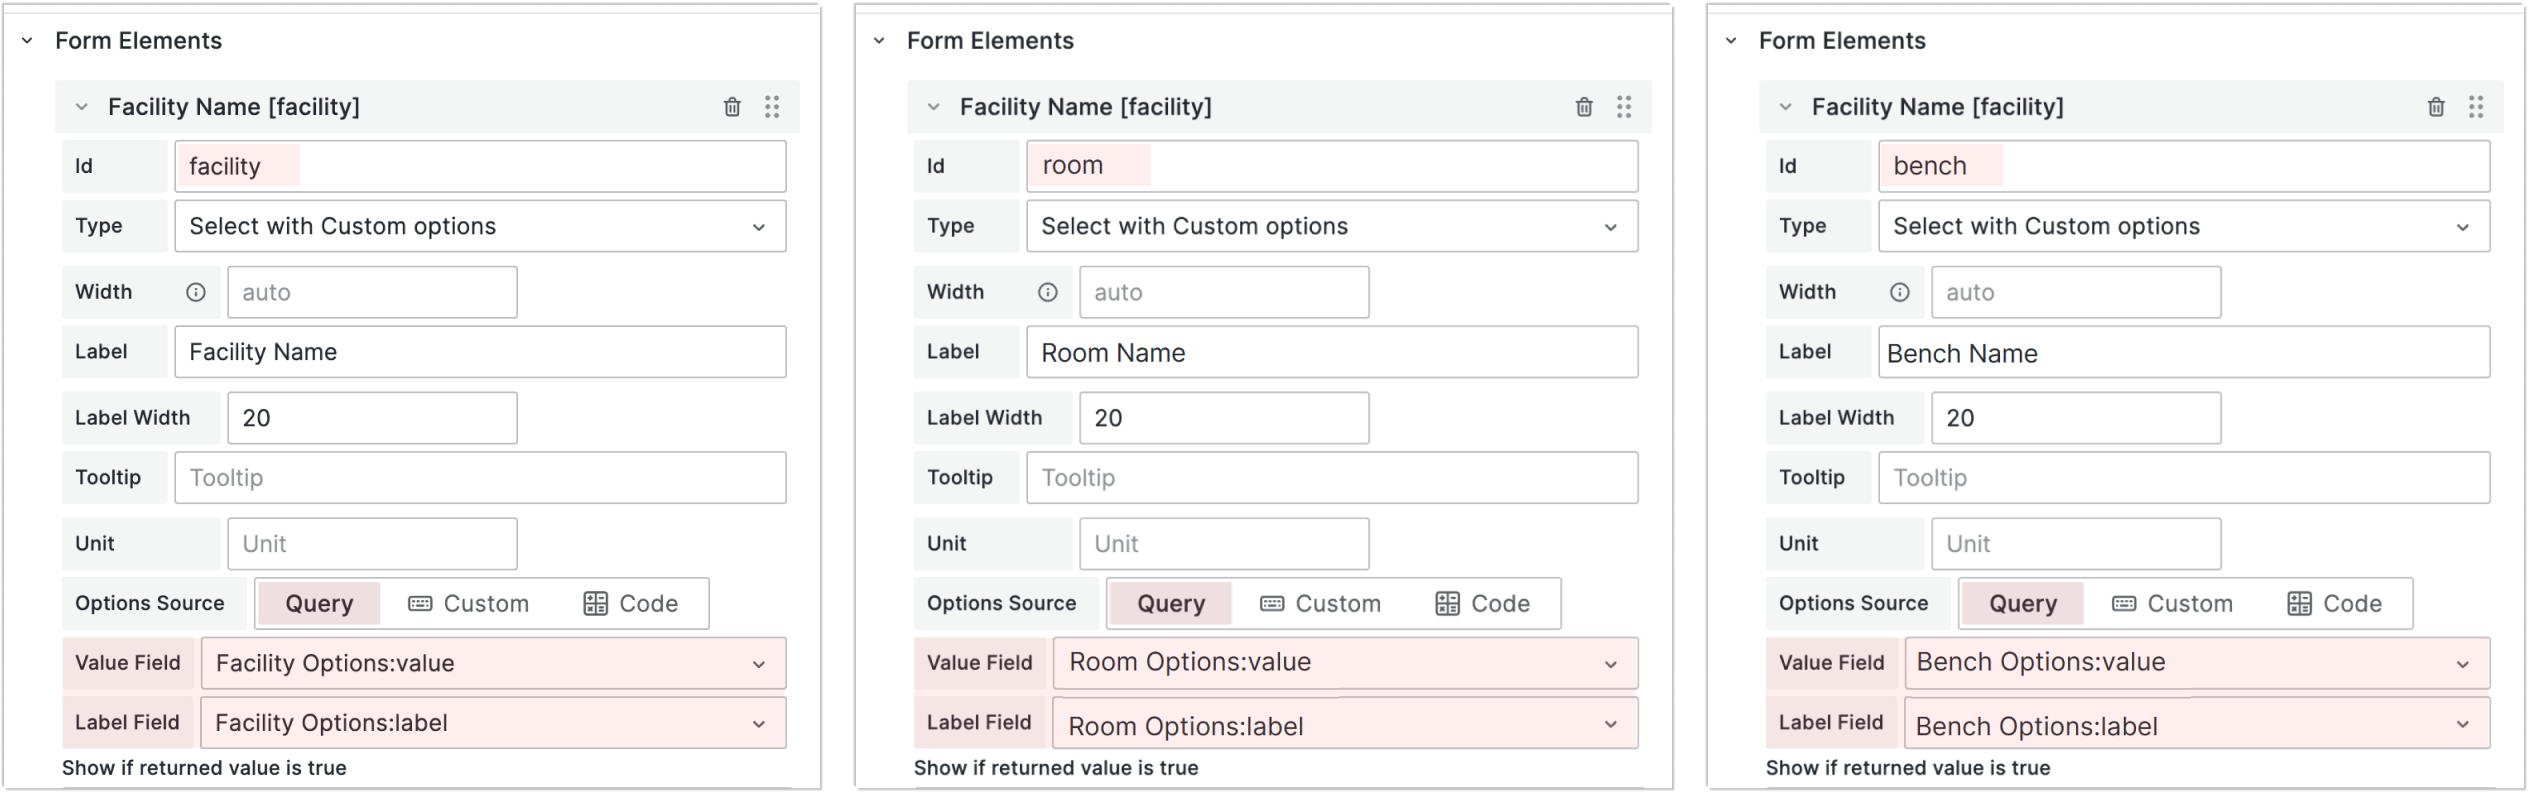
At this point, your Data Manipulation form should have three form elements with hierarchical dependencies. That means that the listing of Room Names is limited by the selected Facility Name and the listing of Bench Names is limited by the selected Room Name.
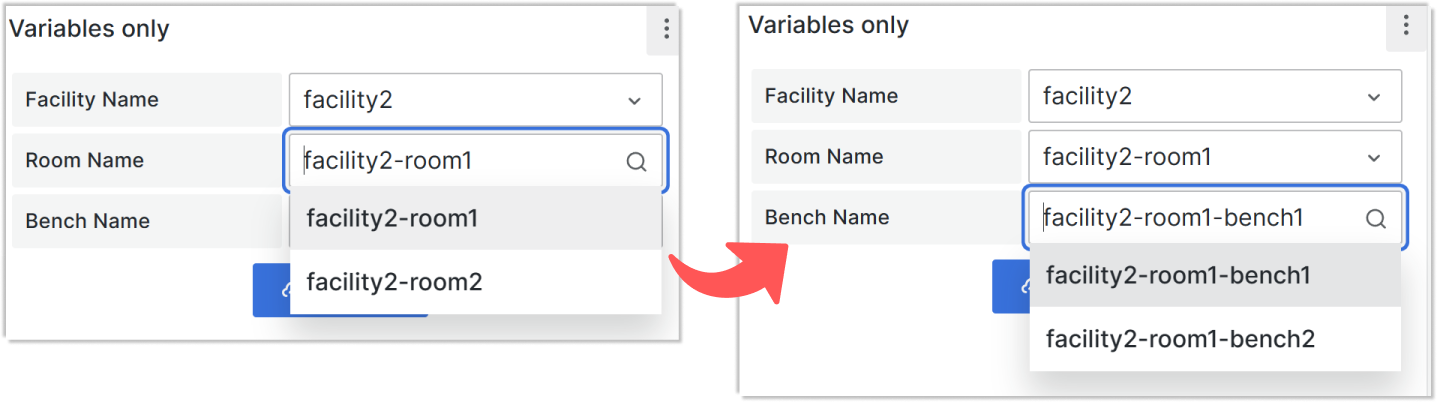
In this example two sets of filters, in the dashboard variables and the Data Manipulation panel, are identical. This comes as an initial requirement. Note, that technically those two lists might differ. However, we are not aware of a good use case for not alike lists.
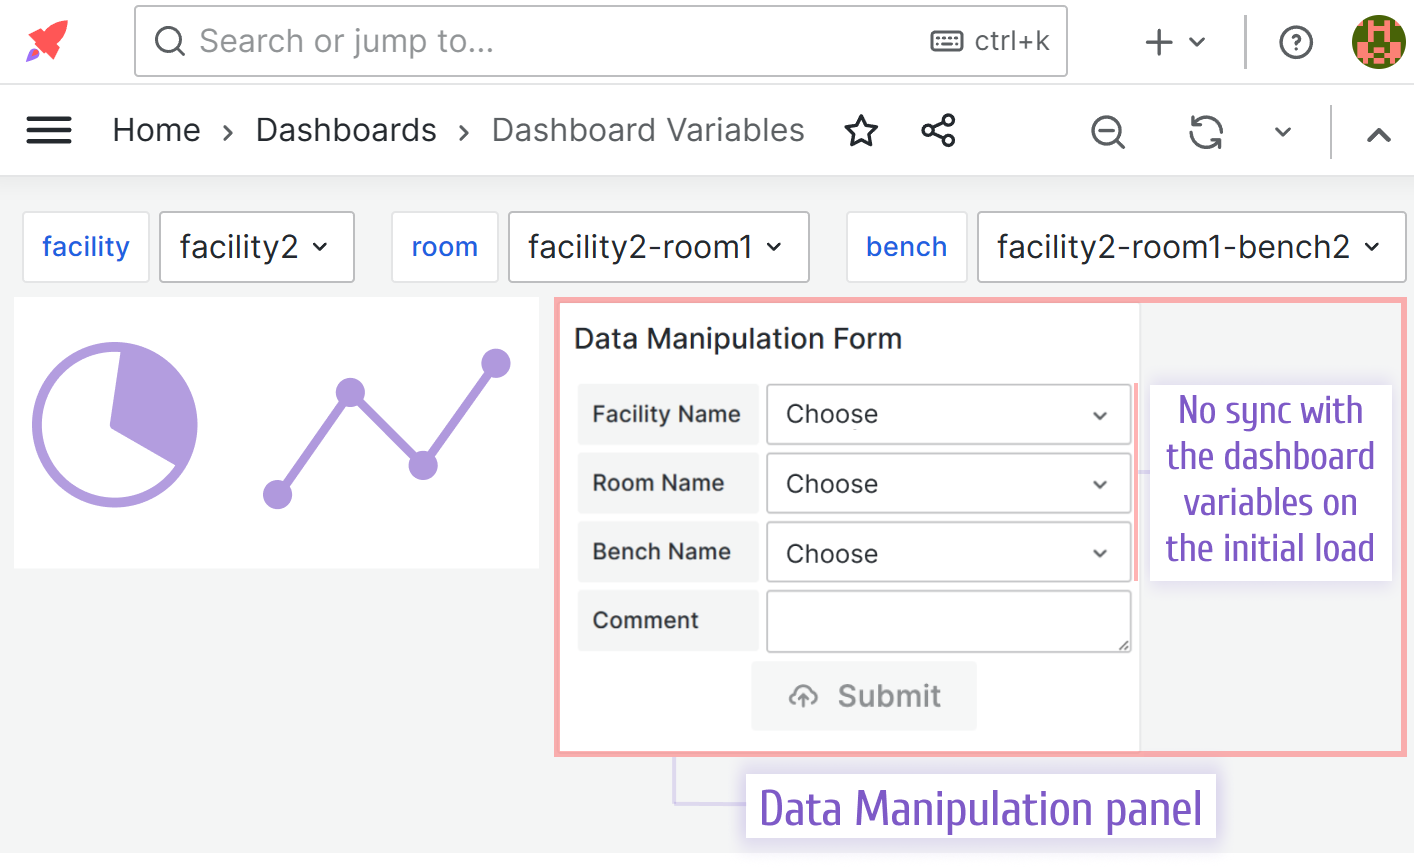
Step 3. Sync the initial values
If you open the dashboard now, the Data Manipulation will display "Choose" in all Select with Custom Options element types. At this step, we sync the Data Manipulation form elements with the dashboard variables for the initial load event.
To facilitate the Initial load synchronization between dashboard variables and the Data Manipulation form elements we add the query and select the corresponding Initial Action.
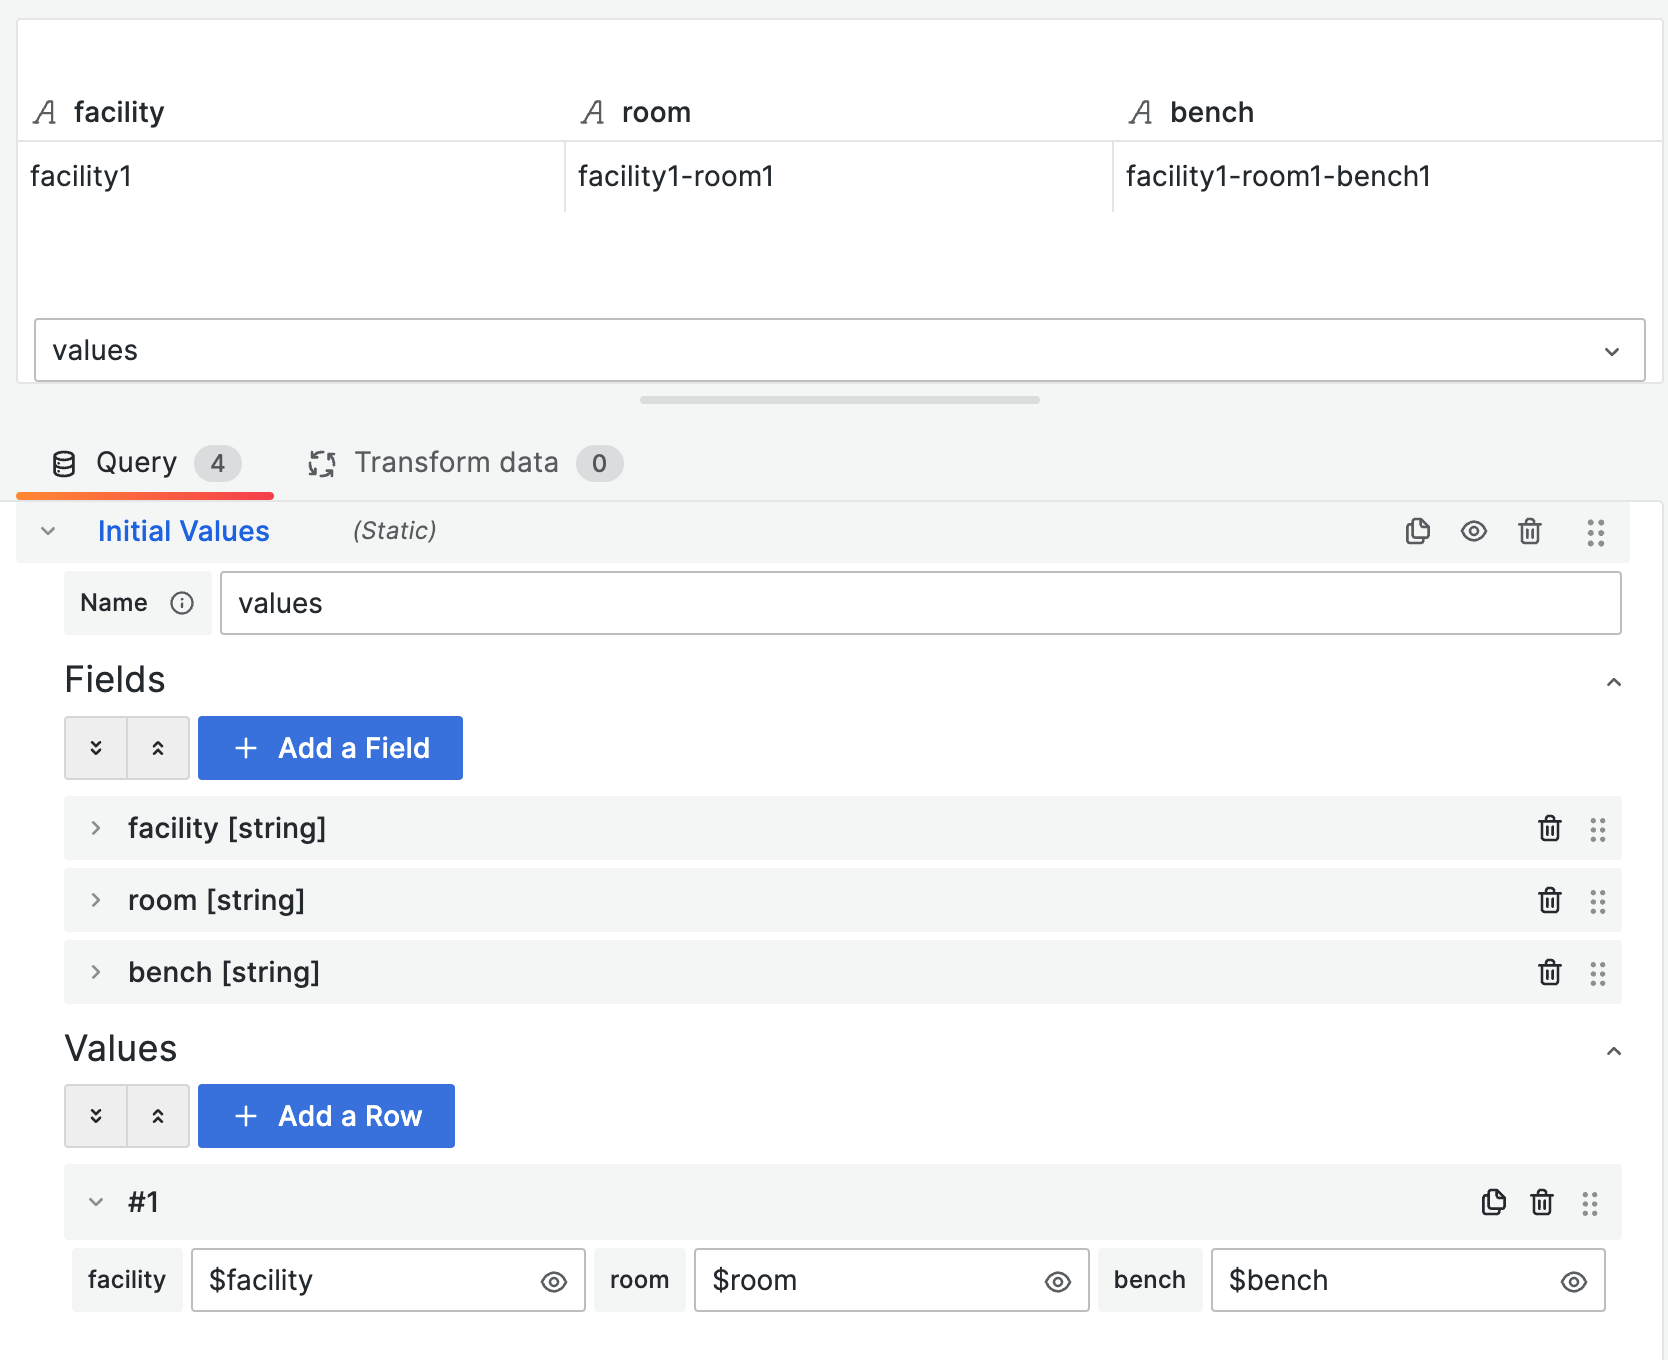
Query
Add a new query to the Data Manipulation Form returning the necessary values. We name it 'Initial Values'. In the values specify a reference to the corresponding dashboard variables.
Initial Action
Update the Data Manipulation panel options to enable the Query option for Initial Action.
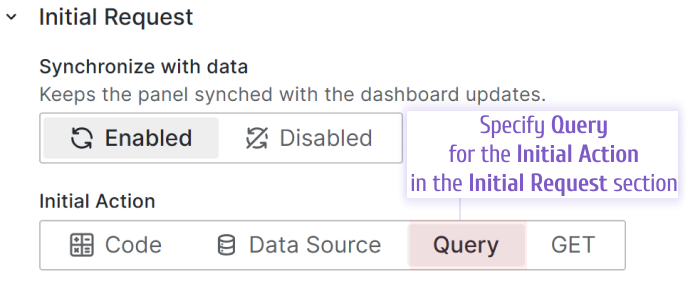
For every form element specify the field where an initial value should come from. When the Query selected in the Initial Action, a new parameter Query Field appears. Populate it with the appropriate field name.
Step 4. Ensure the values synchronize in real time
In this step, we ensure that the changes are reflected in the dashboard variable whenever a user changes anything on the Data Manipulation form. That can be done in the newest Data Manipulation option Element Value Changed, section Form Events.
The opposite synchronization is already in place since the values for the current Data Manipulation form elements are taken from the dashboard variables using data source.
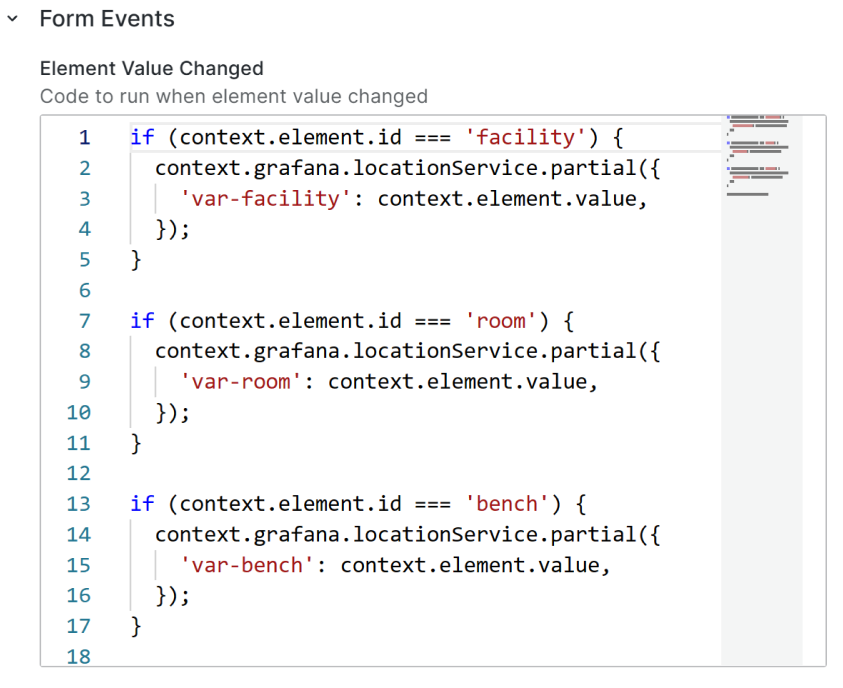
The JavaScript code to ensure the dashboard variables follow the Data Manipulation form elements selected values:
if (context.element.id === "facility") {
  context.grafana.locationService.partial({
    "var-facility": context.element.value,
  });
}

if (context.element.id === "room") {
  context.grafana.locationService.partial({
    "var-room": context.element.value,
  });
}

if (context.element.id === "bench") {
  context.grafana.locationService.partial({
    "var-bench": context.element.value,
  });
}
Step 5. Enable submit button
The most appealing scenario is when the Submit button is initiated in the disabled status and is enabled only under certain conditions, for instance, form element value change.
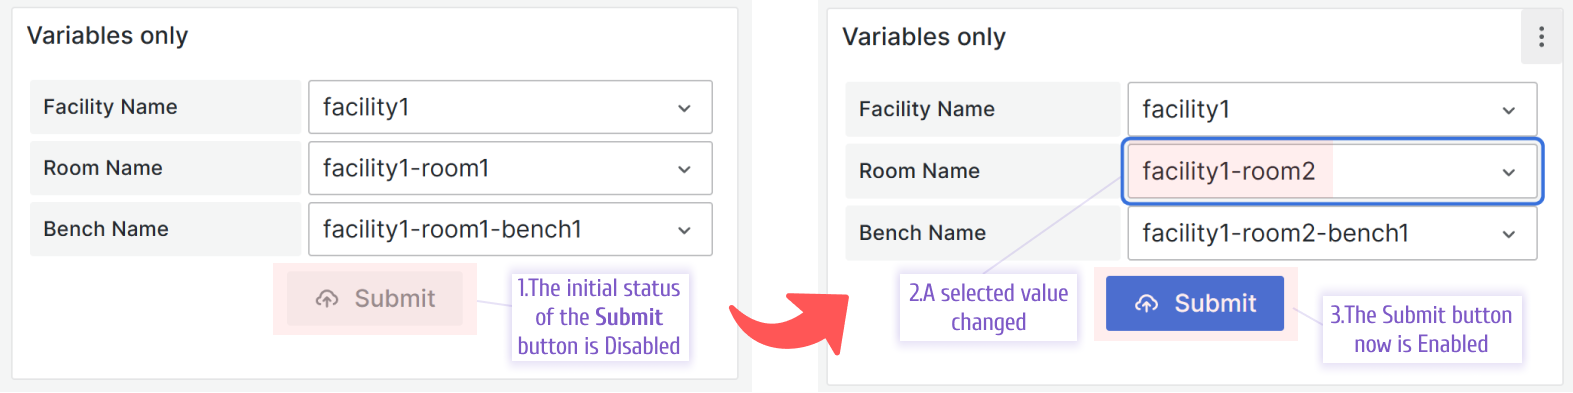
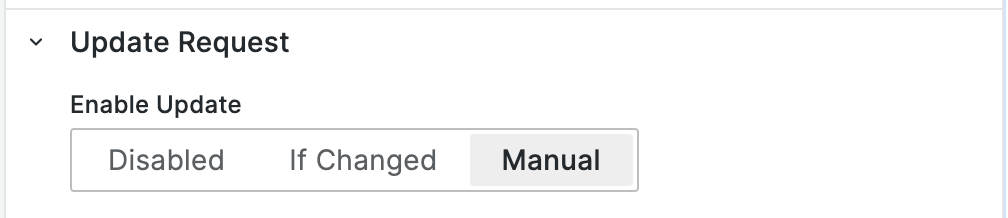
That can be achieved by changing Enable Update option to Manual.
JavaScript Code
Modify the JavaScript code in the Element Value Changed by adding one row at the end.
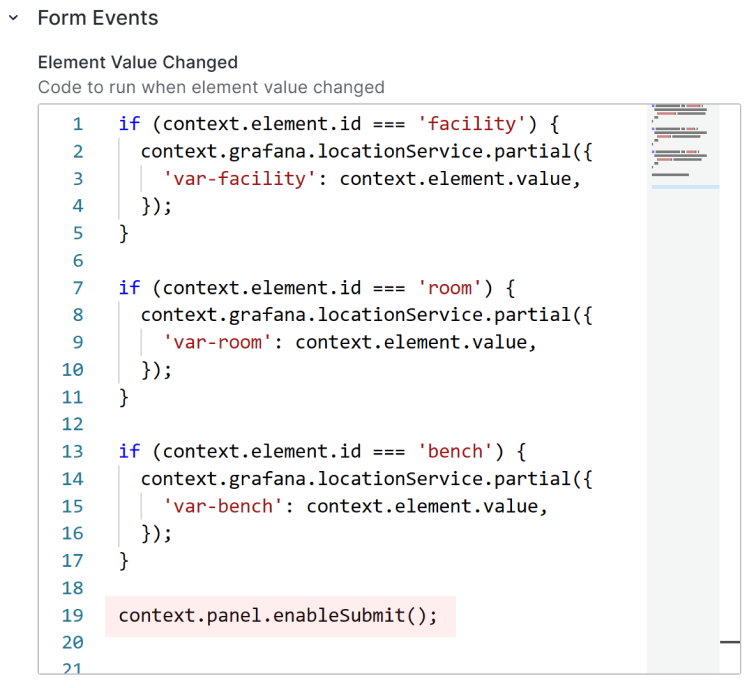
JavaScript code to enable the Submit button manually.
context.panel.enableSubmit();
Congratulations
We hope you were able to follow the provided steps and arrived to the same results as we did. If yes, congratulations to you, you now are ready for the next Grafana adventure.
Explore further on our GitHub
A working dashboard example is available in the GitHub repository.
If you have any questions about this article, please, do not hesitate to leave them in the comments section under the YouTube videos.