
Most of the time, Grafana is considered as a superb system monitoring and observability tool. However, Grafana has much more to offer.
In addition to beautiful and informative dashboards, Grafana is capable of process control. Two simple words hide the whole application universe behind them. Technically, process control means sending data back from the dashboard into a data source. Strategically, that could mean converting your dashboard into a full-scale web application.
But let's take one step at a time.
This article describes a use case demonstrating how a user can control an NVidia Orin device from a Grafana dashboard. To spice things up a bit, we enhanced the device by mounting the following:
- A custom Electrophoretic Display (EPD) to show IP address, MAC, device name, and a QR code to access the hosted web application for process control.
- LED lights to indicate a status by various types of blinking.
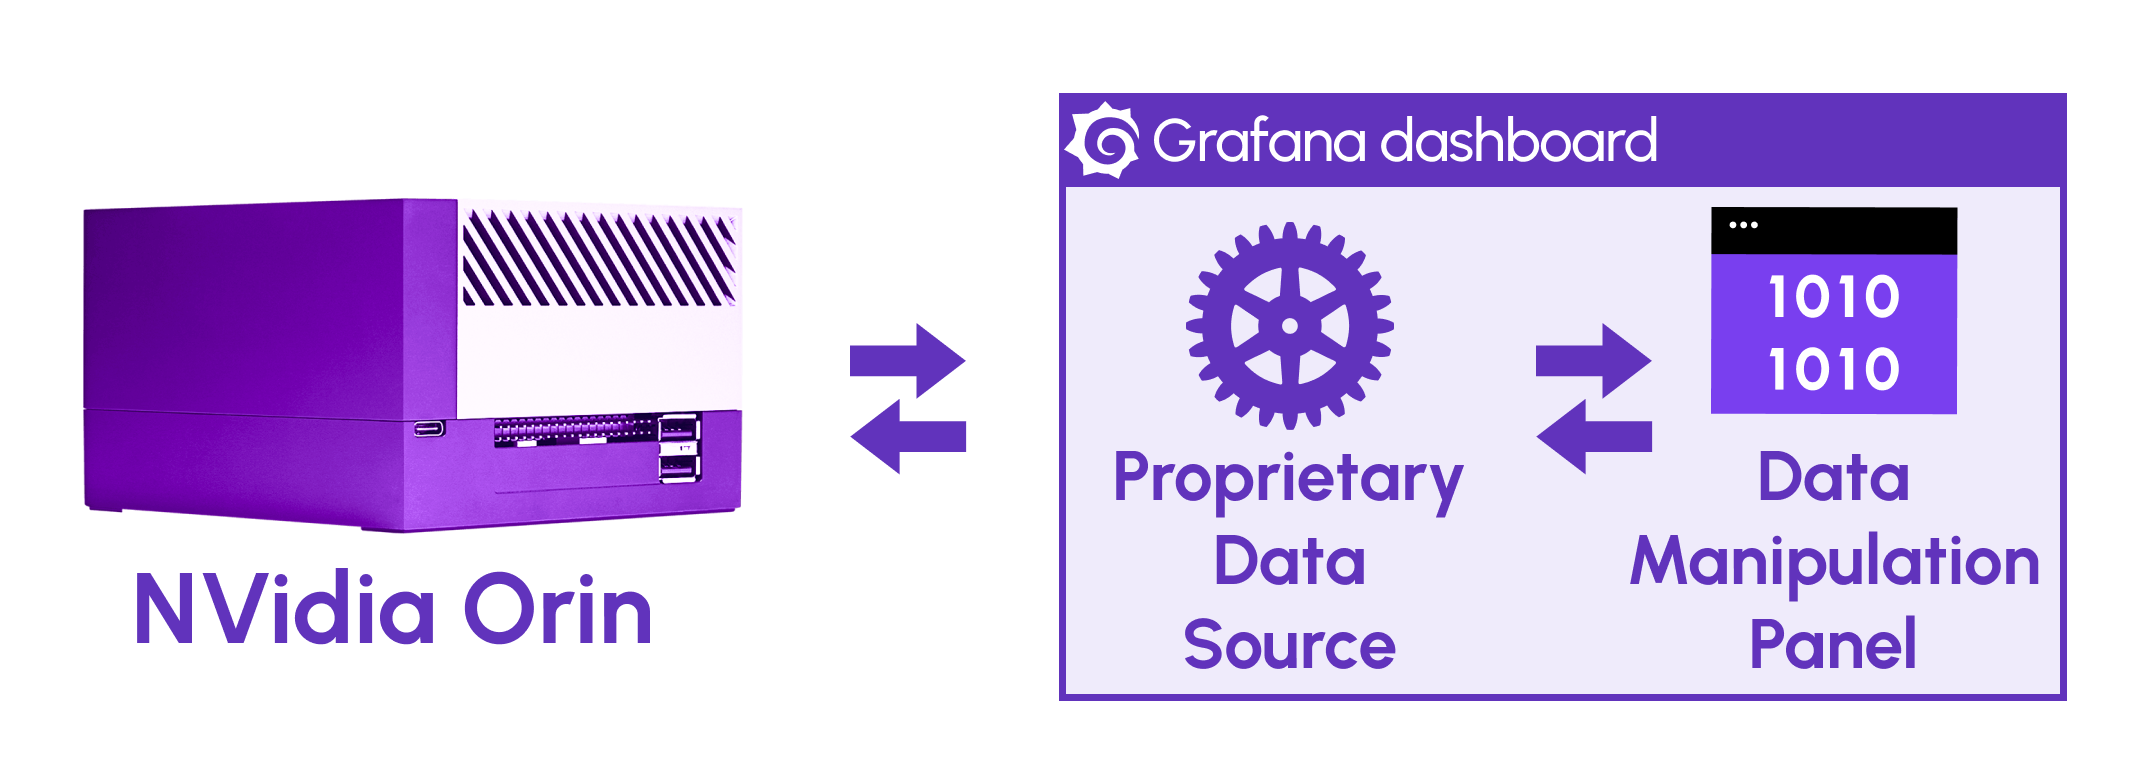
Schematically, the described solution can be depicted in the following illustration. An NVidia Orin device interacts with the Grafana dashboard which contains two main actors - a proprietary data source created specifically for the utilized device and the Data Manipulation plugin.
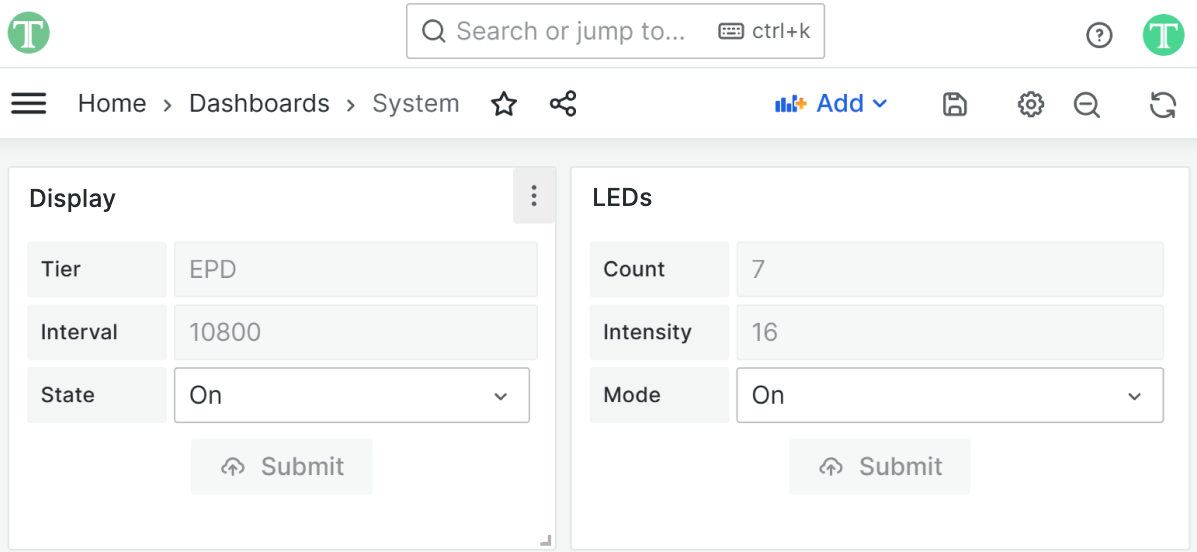
The final Grafana dashboard contains two Data Manipulation panels:
Displaywith Tier and Interval as read-only metrics. A user can change the device State between on and off using the drop-drop element.LEDswith Count and Intensity as read-only metrics. A user can change between different Modes. Here, a mode is how the LED lights are animated.
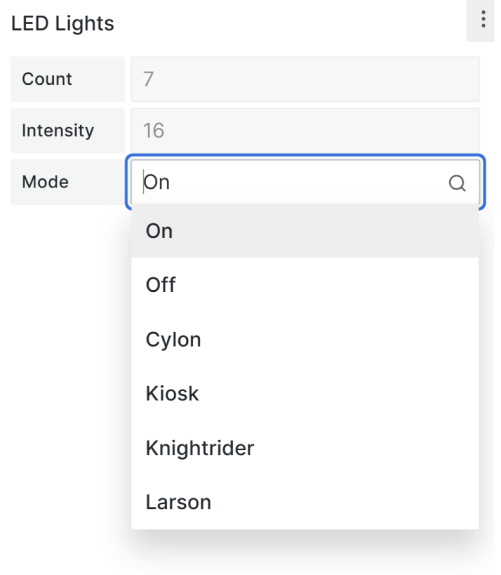
All possible LED Light modes:
For instance, LED Light in the Cylon mode:
Another example, LED Light in the Kiosk mode:
Down below in this article, we describe in detail how to configure the LEDs Grafana panel. The configuration of the other panel, Display is very similar.
Proprietary Data Source
To work with our NVidia Orin device we developed a proprietary front-end data source. It uses REST API calls to:
- read the necessary device information and transmit it to a connected dashboard,
- send the data from a dashboard back to a device.
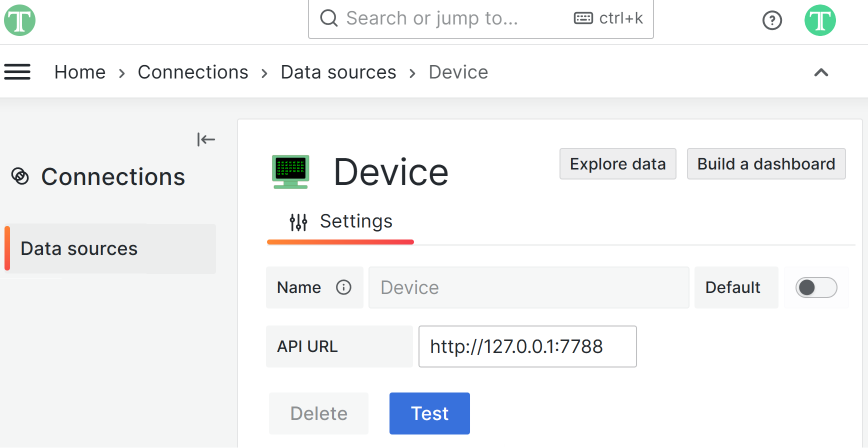
The configuration of this data source requires a name and API URL.
Connection configuration
Dashboard configuration
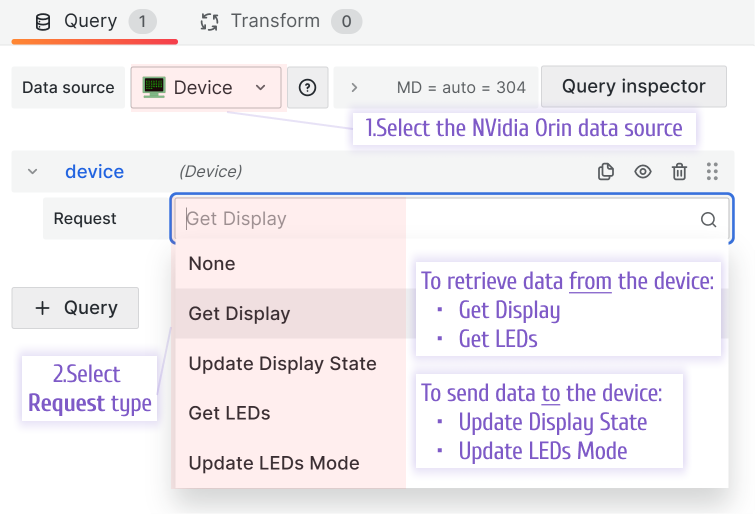
On the dashboard, when the appropriate data source is selected from the list, the Request drop-down appears.
It contains all available request types, which we added to our proprietary data source. Two requests are created to fetch data, and two to submit the data back into the data source.
In this particular selection, only the ones to fetch data make sense and will work (Get Display and Get LEDs). We will use the Update LEDs Mode request in the Update Request section of this article.
Data Manipulation plugin
We created the Data Manipulation plugin to make sending data back into a connected data source possible. That simple idea allows users not only to overview the data but also act upon it right on the Grafana dashboard.
This makes the Data Manipulation plugin the ideal candidate for managing your devices from a Grafana dashboard. Below we will review in detail how we configured the LEDs Data Manipulation panel on our dashboard.
Data Source and the Initial Request
We start with choosing the NVidia Orin data source and selecting the appropriate Request type which in our case is the Get LEDs in the query editor.
As you can see in the illustration below, this type of Request fetches three metrics:
- Count,
- Intensity,
- Mode.
Next, on the right-hand side, we obviously select the Data Manipulation plugin from the plugin drop-downs.
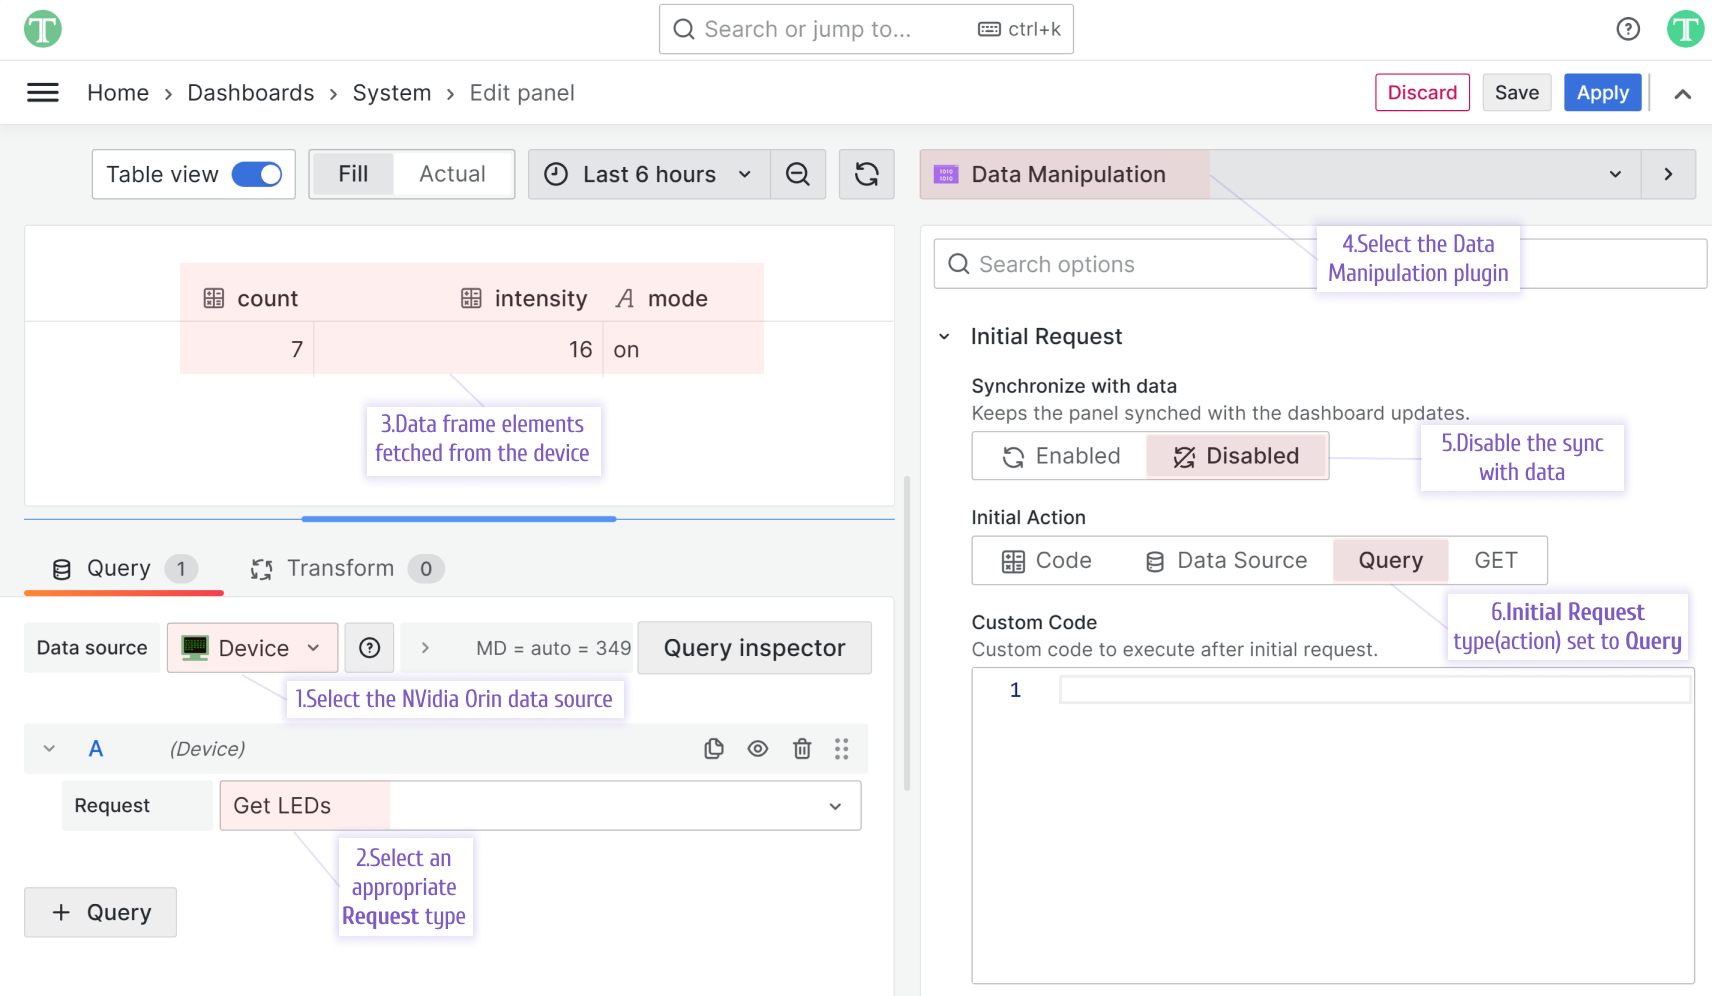
For the plugin options, in the Initial Request section we set the following:
- Synchronize with data to Disabled. Let me explain. As you know, every Grafana dashboard has a configurable timespan for a dashboard refresh (where a timespan is how often a dashboard refreshes).
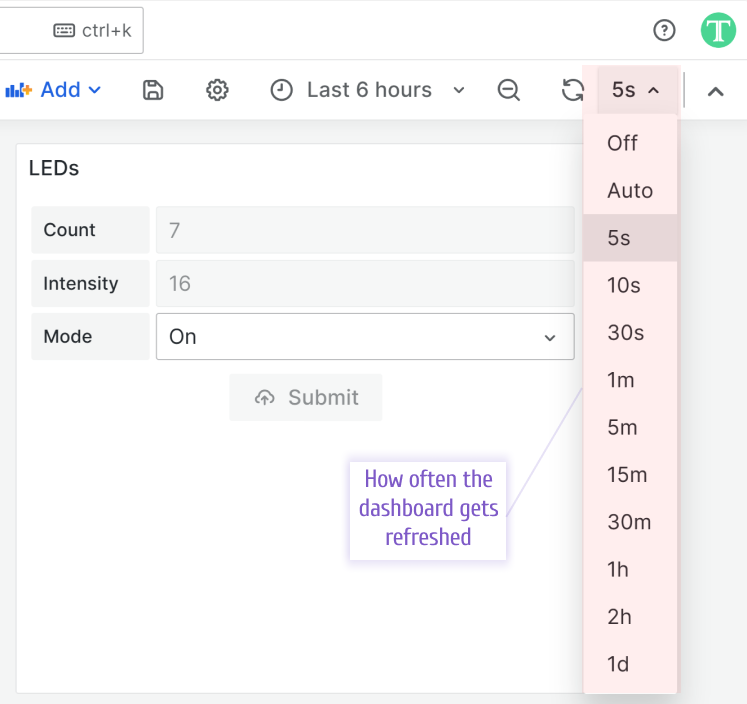
When Synchronize with data is Enabled with every such refresh, the data populating all Data Manipulation form elements is re-fetched from the data source. To prevent the Data Manipulation form elements to re-fetch the data with every dashboard refresh, we set Synchronize with data to Disabled.
- Initial Action to Query. This setting instructs the plugin to use data fetched by a data source. It also adds a Query Field option for all form elements to allow the mapping of form elements to data frame columns. We will set it up next.
Form elements
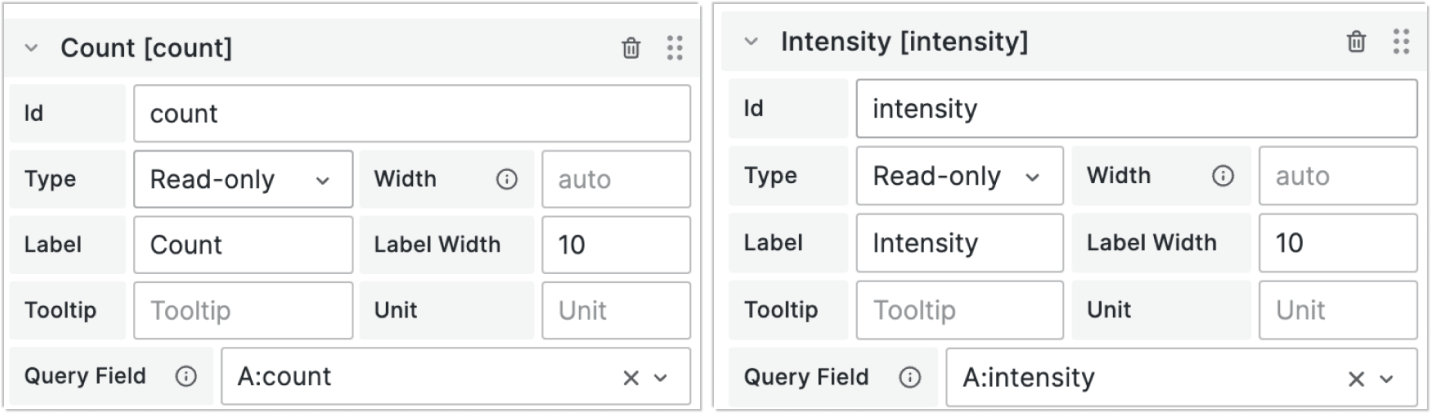
Now we can create and configure form elements. We need two Read-Only types to review the device's stats. We specify id, type, label and use the Query Field to map with the data frame columns.
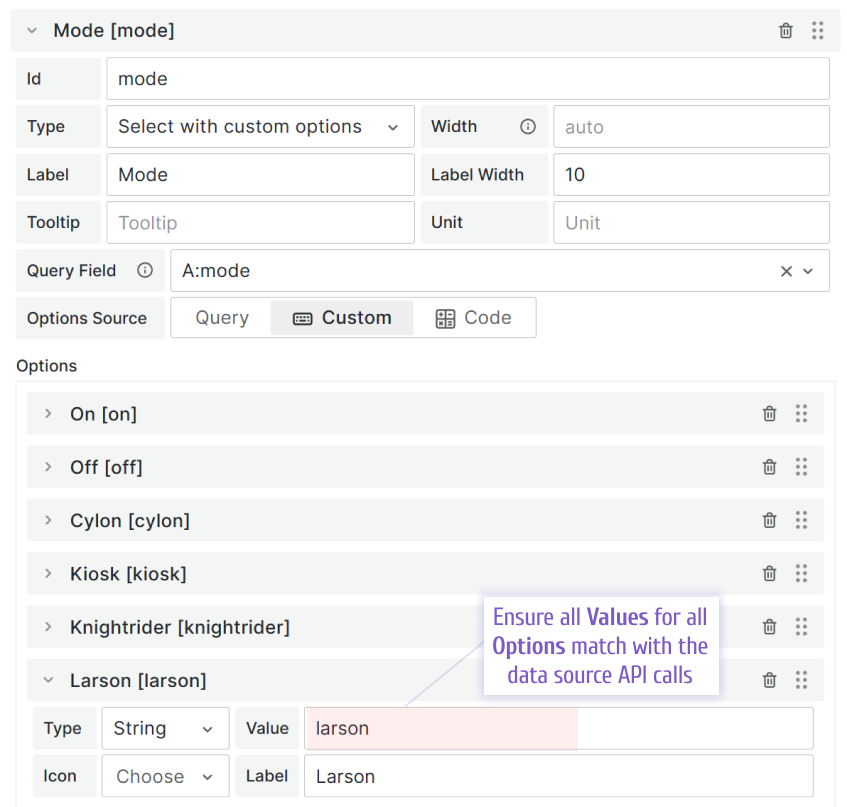
We also need one Select with custom options type to allow users to modify the current LED Light blinking mode. For this type, we similarly to the previous ones specify Query Field and then using the Options Source set to Custom create the listing of all options we need. While doing that we ensure that the mode values match between the data source API calls and specified here.
The described above steps sum up the Data Source and Initial Request configuration. With that, all form elements should be initiated with the current device's values coming from the Get LEDs request.
Update Request
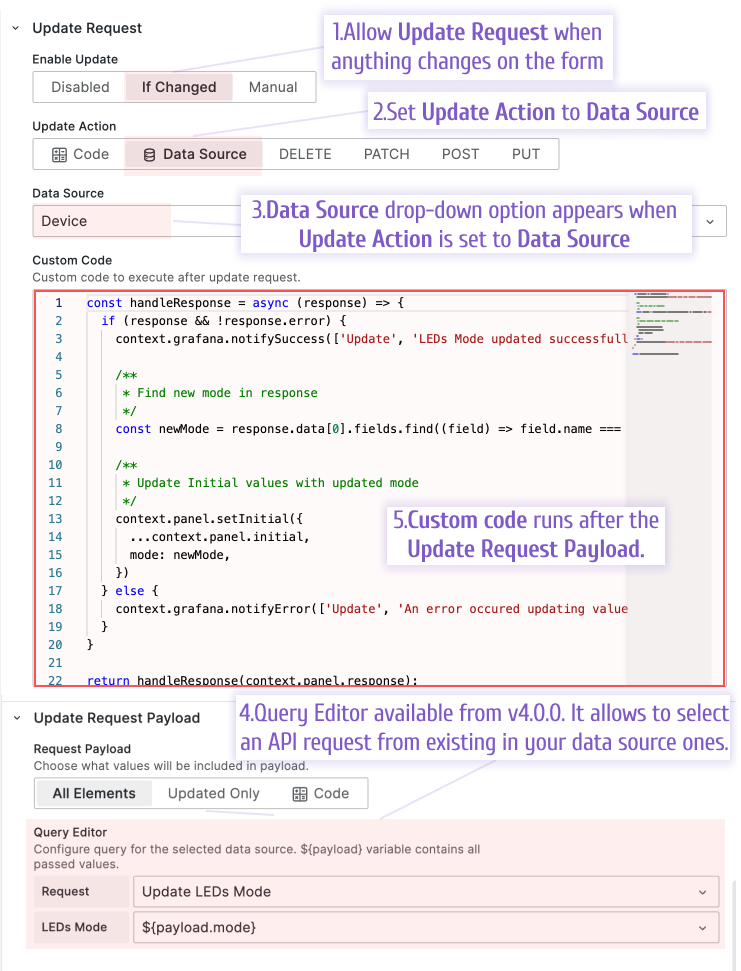
The Update Request is responsible for sending data back into the data source and, thus, performing the process control magic we mentioned at the beginning of this article.
The configuration looks as in the illustration below:
You can copy the code provided in the above screenshot here:
const handleResponse = async (response) => {
  if (response && !response.error) {
    context.grafana.notifySuccess(['Update', 'LEDs Mode updated successfully.']);

    /**
     * Find new mode in response
     */
    const newMode = response.data[0].fields.find((field) => field.name === 'mode')?.values[0];

    /**
     * Update Initial values with updated mode
     */
    context.panel.setInitial({
      ...context.panel.initial,
      mode: newMode,
    })
  } else {
    context.grafana.notifyError(['Update', 'An error occured updating values.']);
  }
}

return handleResponse(context.panel.response);
Please, note that we also update initial values here to ensure the form elements (mode, in this case) are updated timely with the user actions.
Final result
After all described above steps, we ended up with the Data Manipulation form that displays the current device stats allowing users to modify behaviour of Display and lights.
Please feel free to ask any questions related to the discussed in this article materials. You can do it in the Comments section under any video on our YouTube channel.