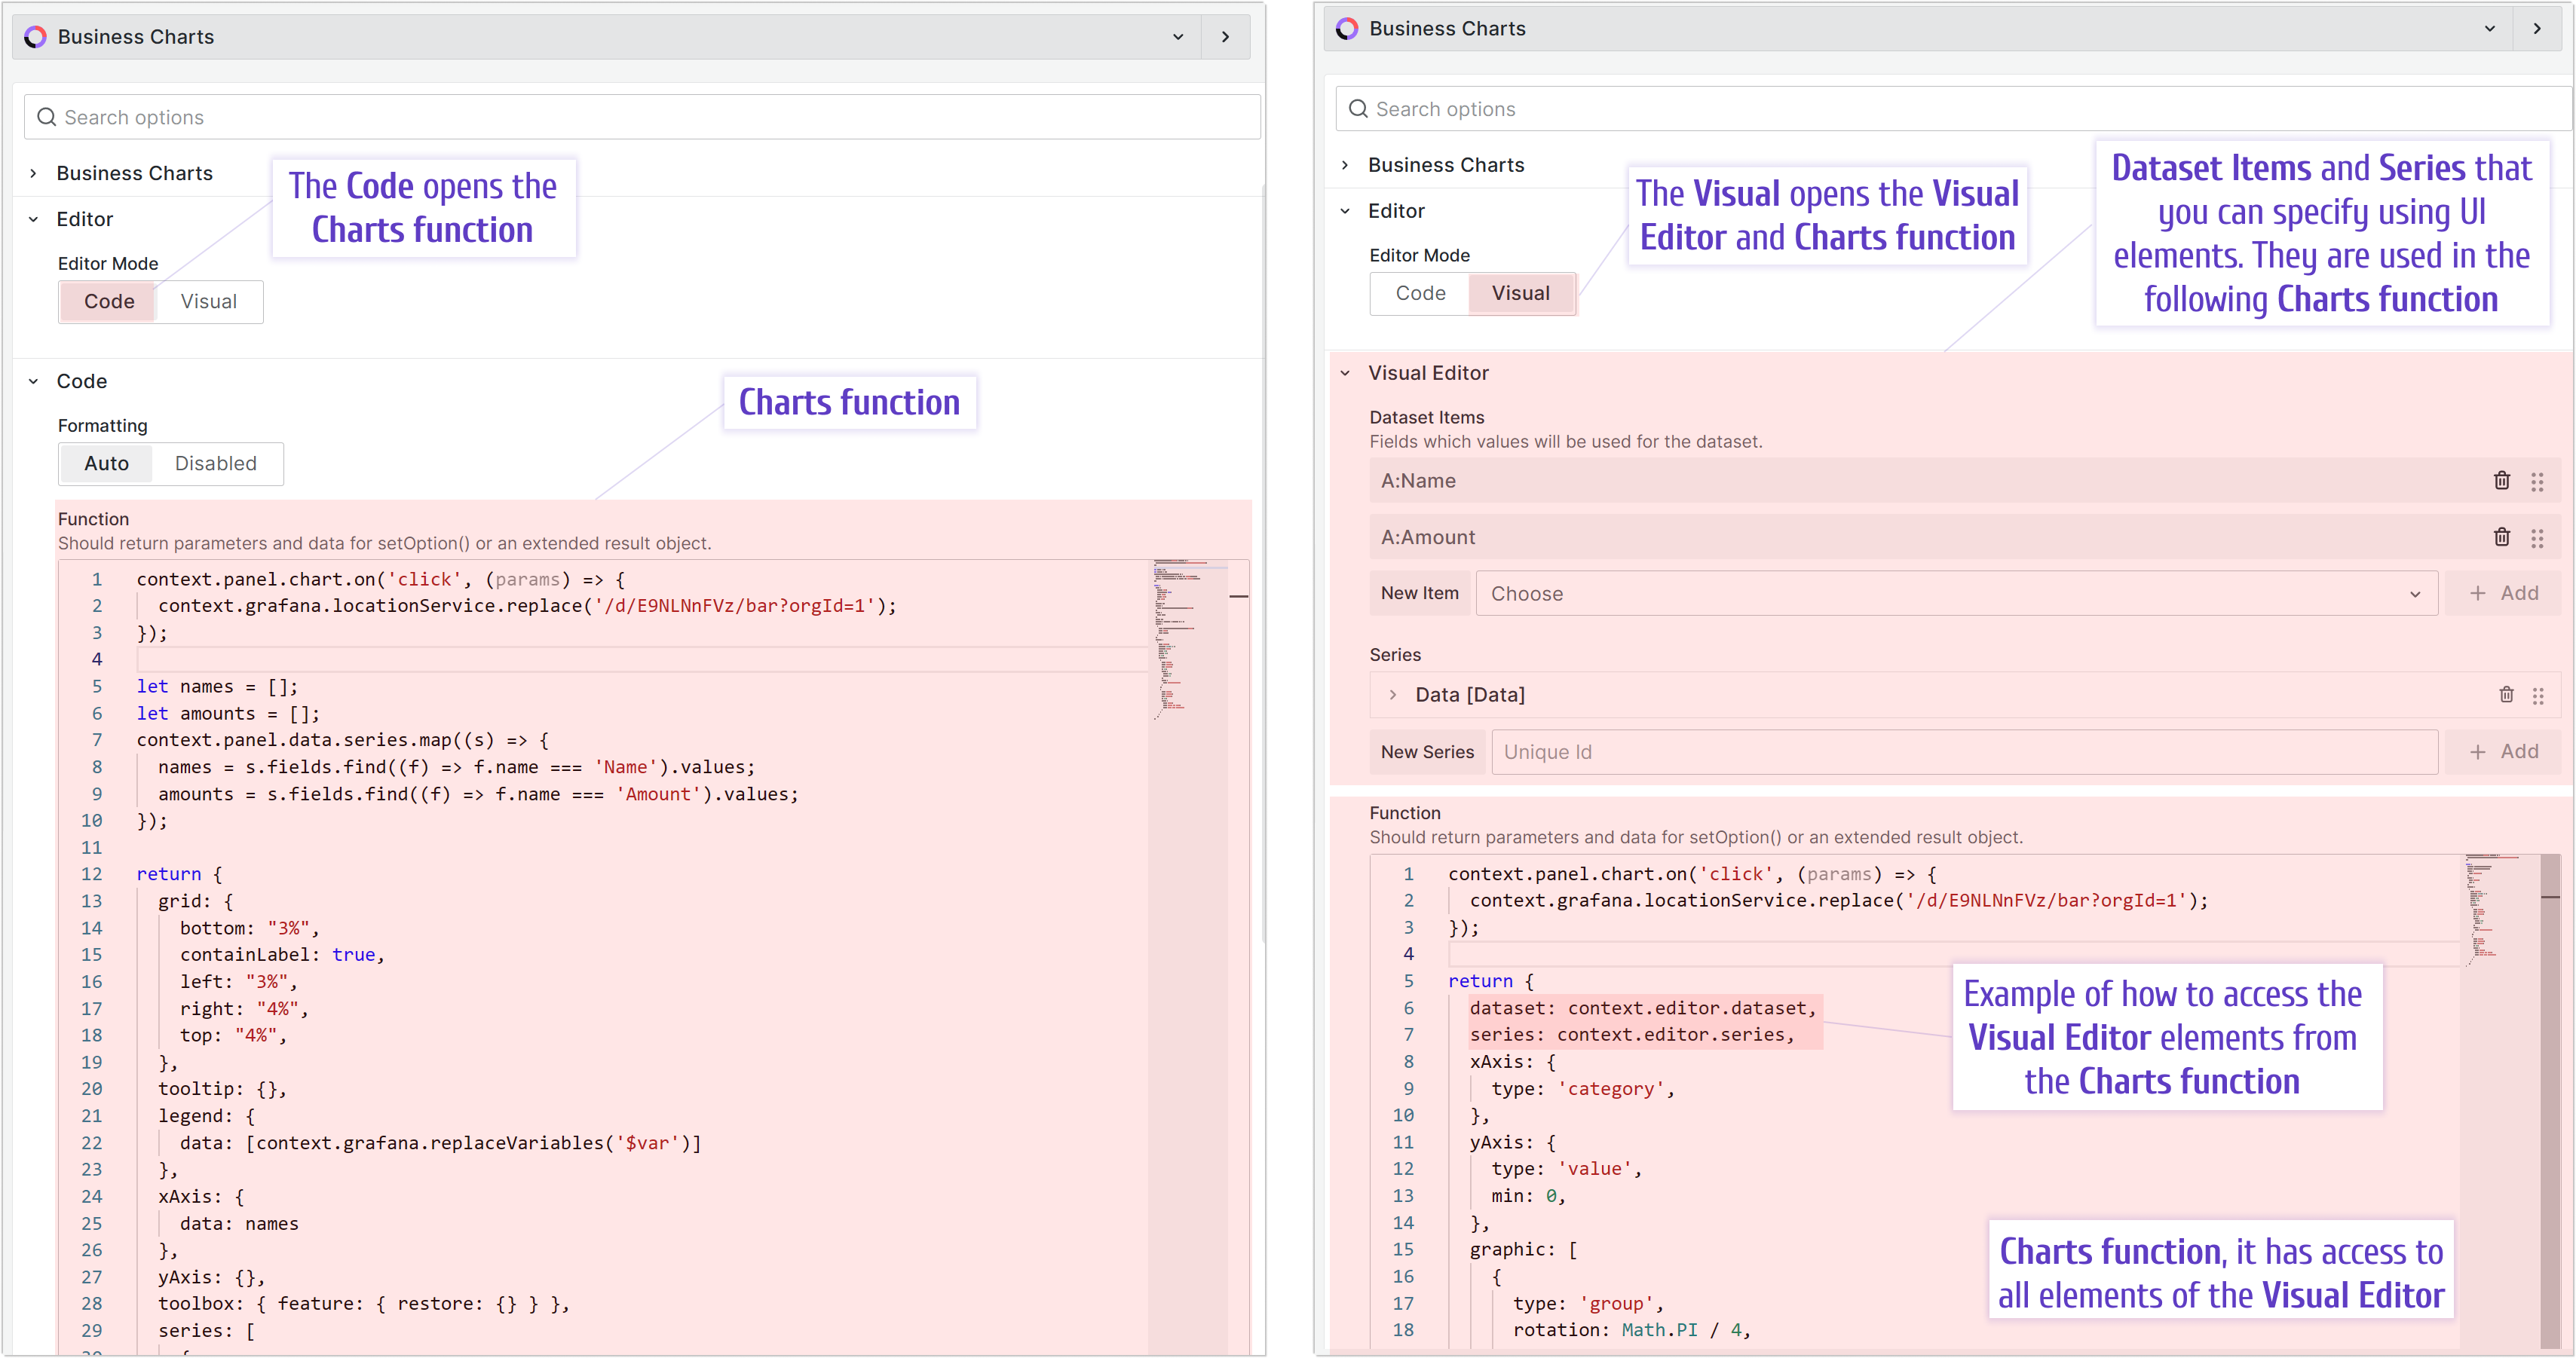
Visual Editor
This is one of the most exciting features. Instead of using JavaScript code, you can use UI elements to specify datasets and series for the chart.
Beta version
This feature is in the beta version. As of now, it should work for simple charts. If your use case requires complex logic, use the Code mode.
Examples
To get you started faster, we have prepared many examples of how the Visual Editor can be used.
Please, check out the Examples section of the documentation.